Slope of Hope Blog Posts

Slope initially began as a blog, so this is where most of the website’s content resides. Here we have tens of thousands of posts dating back over a decade. These are listed in reverse chronological order. Click on any category icon below to see posts tagged with that particular subject, or click on a word in the category cloud on the right side of the screen for more specific choices.

The Health Of The Consumer (By Runedge)

By -

There is a lot of talk in the financial media about the strength of the consumer.  Pundits will tell us to never count the consumer out.  The holiday season was strong, iPad sales are strong, the high end consumer is spending.  In a word, nonsense.   

The number of people in some form of default on their mortgage continues to rise.  The average time from the first missed payment to REO is in excess of fourteen months and higher depending on who is reporting.  Imagine not making a mortgage payment for fourteen months.  What do you do with that money?  You don't save it all.  You spend it on things you are "entitled" to because the sad truth right now is our society for the most part feels entitled.

Consumers guard their credit card and HELOCs because it is their only form of credit and yet the banks spin this as a positive about their assets, their credit quality.  Again, I say nonsense.  I came across two charts that really support this view.  

For the first time in over sixty years, Americans had a net withdrawal of financial assets, whether it be savings, 401K plans, etc.  Americans are suffering hard right now.  One in five are employed part time. Part time work is necessary and there is nothing wrong with that form of employment but the reality is you cannot grow an economy with limited wages and reduced benefits.


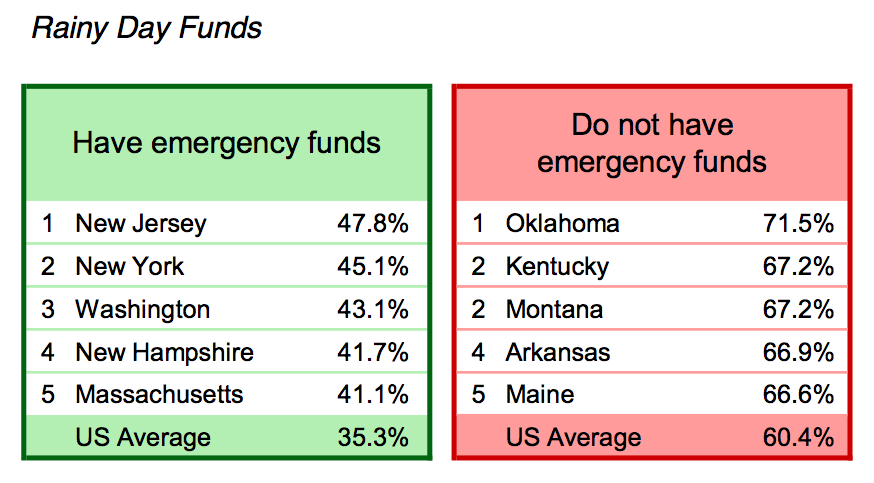
Now this one was the scary report from FINRA.  The simple question, how many Americans have available funds to cover three months of normal expenses.  35.3% do while 60.4% do not.  GOD forbid someone loses a job, for every three that lose work today, two need immediate government aid.  One in seven Americans are on food stamps.  There are many people hurting right now and for the media and financial system to spin it as all is well is very sad.  


Submitted by Runedge.  If you would like to follow my blog please visit - Ultra Trading

A Prediction Fulfilling (by BKudla)

By -

Last March I wrote my first post for Tim and discussed what can stop the Fed.  At the time we were going through our second bout of uninterrupteded ramping in the market, and I speculated on what will kill the economy.  Please read here for the post

http://slopeofhope.com/2010/03/index.html

At the time the price of oil was $81, the price of gold $1130, and the interest rates were 3.7%.  In one short year, all of the levers that will kill the Fed's ability to strengthen the economy through more debt are now pushing hard against them, and are at breaking points for the economy. 


In addition, our inconvenience in these areas of price increases are turning into calamities overseas.  China and India are experiencing food inflation that, in my view cause world changing social unrest. South Korea is releasing emergency food stockpiles to ease pricing pressures, North Africa is experiencing regime change, and the other two BRIC countries, Brazil and Russia are suffering from these same hot money flows.  Oh, and don't forget Europe.  We are one bad harvest away from a worldwide upheaval (a post for another day)

All of this calamity because the TPTB are protecting the bank and other fixed income bondholders.  All of the extra money created worldwide is being used to buy hard assets (and being hoarded) with the fake money, and the money is being politically directed.  So in the end, the imbalances continue until the masses here in the U.S. can't absorb the costs anymore.  That time has come; as I always contend, the price of energy is the silver nail into the Fed.  Food and transport companies are getting crushed via margin pressure, and they will release that pressure onto us.  As that happens (already begun) the political heat ends the games and the long awaited debt destruction spiral can and will begin.

My bias is that we profit correct out of this quarter, the politicians panic regarding the Muni crisis, and we move into our last bout of the bubble, then it gets ugly.

Enjoy your weekend  :-), and go Steelers.

Major Commodities Top? (by Springheel Jack)

By -

I've been mentioning for a while that we're in an area where we could see a very major commodities top, and I'm aware that my view is at best a minority view, but I'd like to put the case anyway, and to stress that I'm seeing this from the perspective of an chartist who mainly calls reversals on the basis of trendlines, and to show how impressive some of the trendlines are that commodities have recently reached and, so far, reversed at. I can only show a few of the commodities here so I've chosen copper, silver, oil as three of the most influential individual commodities and CRB to represent the commodities complex as a whole.

First the CRB, where the index has reached the lower trendline of the rising wedge that broke down in February 2010. It has also hit the upper trendline of the more recent rising wedge and is showing strong negative divergence on the daily RSI. At this level I would expect to see at least a retracement to the lower trendline of the rising wedge, and if that should break, considerably more. It's also worth noting that in 2010, CRB peaked almost four months ahead of equities:

The next three charts are much longer term charts. The first is the copper chart, where a major long term rising trendline has been reached. The trendline could be hit again short term, but unless we are to see a massive resistance break then that trendline represents the likely high for this move up, and I'd expect to see a move at least to the lower trendline of the shorter term rising channel soon:

The resistance level reached on silver is even more impressive, and the shorter term charts are indicating a retracement back to the 25 level here, and if that level turns out to be an H&S neckline, which it might, then perhaps much further after a bounce there:

The trendline hit is less definitive on oil, but it has hit two significant looking trendlines in recent days, and we may well see a reversal on oil too. It might break up through back into bubble territory of course, but the low stocks and tight production capacity over demand that fed the 2007/8 spike simply isn't there any more, and on that basis, this is a natural reversal level for a substantial retracement:

Commodities are also a currency story as well of course, and on the commodity currencies we saw a major trendline support break on AUDUSD this week. At that break it has formed a very characteristic reversal H&S with negative divergence on RSI, and I'm looking for a retracement to test the important support level at 94 if this continues to play out. It would make sense if that took place within a sharp correction on commodities generally, as the prospects for USD aren't looking promising generally at the moment, in which case any such decline would be likely to be commodity related:

Quantitative easing has fed this boom in commodities, and commodities peaked months before the end of QE1 in late March 2010. QE2 isn't finishing until June 2010, but it may well be that commodities are peaking further before this time. On the longer term charts the real question is whether there will be a QE3, and that is open to doubt.

The Republicans won't be keen, and there would most likely in any case be a gap of several months between the end of QE2 and the announcement of QE3 during which, if 2010 is any guide, we would expect to see equities and commodities tank while bonds soar. If commodities have peaked now, that means that we could well see a ten or twelve month period now where commodities retrace some of their gains in the last two years. In the event that there is no QE3, it might last considerably longer.