
I was writing up my rather mixed view on GBPUSD today for someone, and I thought I might as well post the result for general comments so here it is. 🙂
Cable is complicated and the first thing to look at is the big picture chart first to show the overall context. Overall the long term setup looks bullish as you can see from the monthly chart since 1985, unless the current support trendline from the 2009 low breaks:
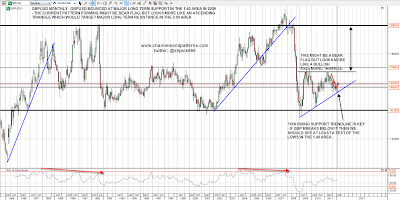
Some might be wondering then why I was considering the bear case so carefully when cable was hitting support in the 1.535 area. Simple, there was and still is a very strong H&S setup indicating back to long term support in the 1.40 area, to make a possible double-bottom there. That's still strongly in play until GBPUSD gets over the right shoulder at 1.6165, and I've seen these play out occasionally in the past even after a bounce over the right shoulder. There is definitely some reason to be cautious on the long side here, particularly while the overall trendline/pattern setup on USD remains bullish:

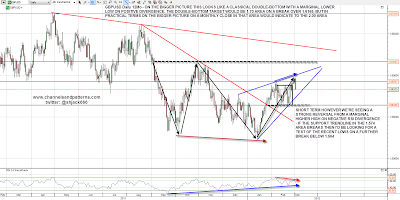
In the shorter term on the one year chart, the recent low was a classical looking double or W bottom at a decent support level. This suggests a move back into the 1.615 level initially, but I was struck on Friday by the strong reversal from some trendline resistance. That was a marginal new high on negative RSI divergence on the daily chart and I'm expecting a test of rising support in the 1.574 area. If that breaks then a possibility of a retest of the recent lows is in play, which would become probable on a conviction break below 1.564:
Another reason to take the bull case for GBPUSD with a pinch of salt at least is the setup on USD. I've posted this chart a few times over the last couple of months, but in essence we're looking at a rising channel from the 2011 USD lows with the lower channel trendline as the likely retracement target for the current move. That hit would set up a right shoulder on a large IHS indicating to the 90.5 area on USD. In the short term I'm watching declining resistance from the January 2012 high on USD, as a break above there might mean that USD has bottomed earlier than I expected. That resistance is being tested now, as you can see from the chart:

That IHS on USD makes good fundamental sense in the current global QE climate. There is no QE3 currently in the US, and while asset markets hold up there's little reason to think that we'll see QE3 in the US anytime soon. The Fed is not reversing any past QE as yet, but current actions do no more than shuffle around existing QE bond assets to play with the yield curve. In Europe on the other hand, and the UK to a lesser extent, there is a very large new QE program that people have been treating as bullish for the Euro. In my view this QE is very bearish for the Euro, and as the Euro makes up 55% of the USD index, very bullish for USD.
The reason for that is simple enough. Quantitative easing works mainly by diluting the current stock of fiat currency. This devalues the currency and boosts asset prices in that currency. Over the QE1 period (roughly), USD fell from 88.19 at the end of 2008 to 74.17 at the end of 2009, it then rallied to 88.71 shortly before the announcement of QE2, and fell to 72.70 by the end of QE2 in March 2011. With no QE3 under serious consideration in the US and serious QE in Europe, there's every reason to expect a big move down on EURUSD and a big move up on USD in 2012.
On this same subject it's worth noting that the UK is still employing QE on a large scale and recently authorised a further £50bn of QE. That's only $80bn or so in USD terms, and seems like pocket change in the context of the US, but the UK is a much smaller country of course. The UK has total government debt outstanding of about £950bn at the moment and this takes total QE in the UK to date to £350bn, over a third of all outstanding government bonds. If QE in the US was of equivalent size, that total QE number would be $4.8tn, a tidy sum, and in effect the very large government deficits in the UK over the last two years have been paid with newly printed money. Given the economic headwinds faced by the UK as the government struggles to reduce that deficit, there may well be more QE in the pipeline, and that should be bearish for GBPUSD as well.
Overall GBPUSD remains a strong buy in the long term support 1.40 area and we might see that area hit in 2012. The short term picture is bullish unless we see a break of rising support from the last low. If we see that, we might well also see USD break up from declining resistance from the January high, and that would be a strong signal that a major swing low on USD may have been made, which would look very bearish for both EURUSD and GBPUSD over the coming months.
