
I was hearing a lot of comments yesterday about how the current bull move is unstoppable on every timeframe, and that we could only see a pullback when every last bear had capitulated. What garbage. Nothing goes up in a straight line, and every trend has pullbacks. They may be shallow but we will see them. It may well be that those pullbacks will just be deeper dip buying opportunities but they will come. I don't see much to suggest that a major top is near here, and I'm leaning bullish into May, but there are always some bumps in the road. As far as I'm aware there are also no recorded historical instances of every single bear capitulating on any bull run in a free market, so I would advise against anyone holding their breath waiting for that here.
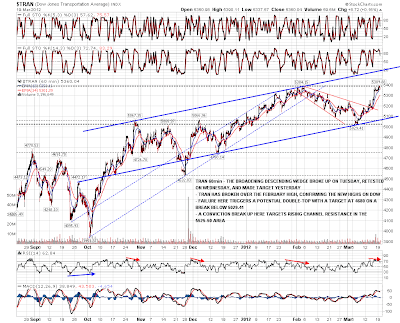
While we're waiting for the next retracement the last 24 hours was very mixed technically. On the bull side TRAN broke the February high yesterday, breaking the short term dow theory non-confirmation by confirming the new highs since February on Dow. There is a still a larger scale negative divergence of course until TRAN breaks the 2011 high there. For the moment this was not a break with confidence:
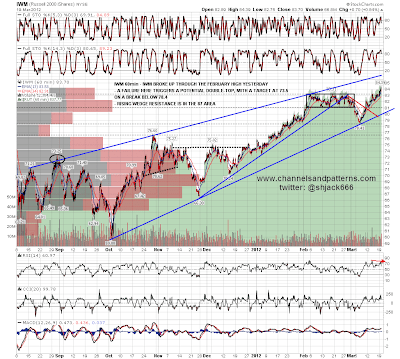
IWM also broke over the February high, this time with some confidence, If the breakout can be sustained then the obvious target and resistance is in the 87 area:
My four month resistance trendline on SPX finally broke yesterday, after showing some signs of wear on Friday. This is a two edged sword from a TA standpoint. If the breakout can be sustained it is a strongly bullish break. If it is reversed quickly it is a rising wedge overthrow, and suggests that rising wedge support in the 1365 area should be broken on the next swing down, with the obvious target then being the March low and rising support from October in the 1340 area:

The ES action overnight is suggesting that the SPX break up yesterday may well be a rising wedge overthrow, as ES has now broken the rising support trendline from the March low. Strong immediate support is in the 1393.5-5 area, and an H&S may be forming. If so we may see a move back into the 1403-5 area today to retest broken support and make the right shoulder for that H&S:

The last equity chart for today is on QQQ, where a nice looking rising wedge has formed since the March low. You can see the trendlines will meet in the next couple of days, so a breakout either way is close:

I had mixed feelings about bonds yesterday and I still have mixed feelings about them. Bonds broke down from the double bottom yesterday and aren't far from my next target at 108.4 now. On the other hand TLT is showing marked positive divergence on the 60min RSI now from an extreme oversold reading, and we might see this bounce very soon. Immediate resistance is at broken channel support in the 111.25-50 area:

I still have mixed feelings about EURUSD as well, but it is at the least currently in a short term uptrend. Rising support from the last low is in the 1.311 to 1.312 area and I'm looking for support there today. A break below there would suggest a test of the recent lows:

At the risk of being burned at the stake as a fed-denying heretic in the current hysterically bullish atmosphere, I'm seeing the support trendline break on ES as a real sign of weakness. Strong support as I said is in the 1393.5-5 area and the low overnight so far is at 1394.25. I would like to see a bounce there into the early 1400s to retest broken support and form the right shoulder on a small H&S. If we do see new highs today I'd be surprised to see them exceed yesterday's highs by muc,h and that should then deliver something I would like to see here, which is negative divergence on the ES and SPX 60min RSIs. The gap fill on ES is at 1404 today.
