
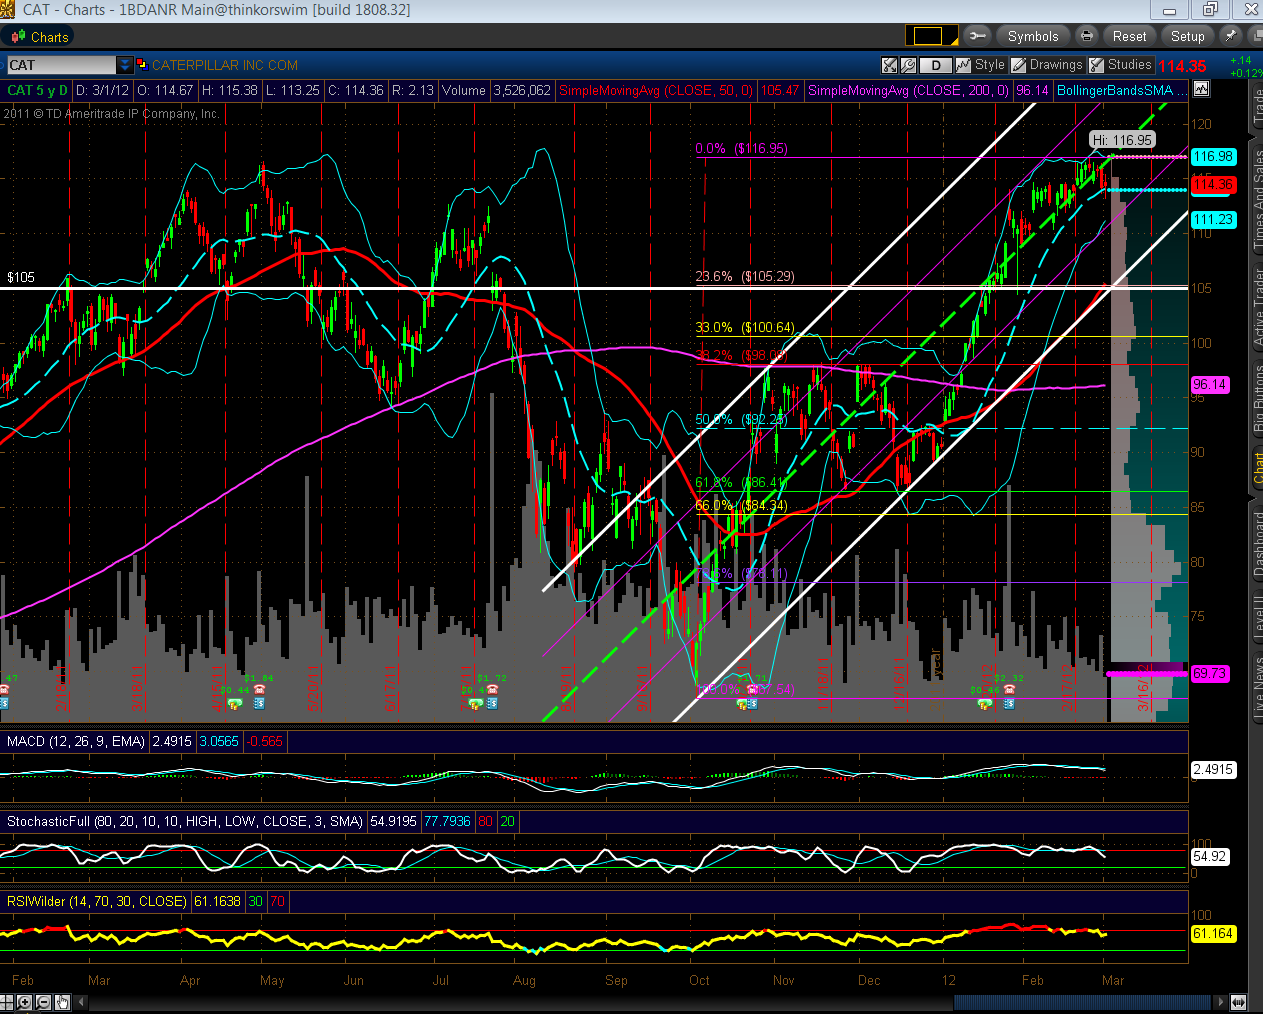
Below is a Daily chart of CAT. Price made a new all-time high on February 24th. There are negative divergences on the MACD, Stochastics, and RSI indicators, volumes are declining, and Bollinger Bands are tightening.
One to watch, in particular, as related to emerging markets and BRIC countries, which are also trading under similar constraints at major resistance levels, as outlined in my post of February 27th.
Near-term support lies around a Fibonacci, channel, moving average, and price confluence level of 105.00ish.
http://www.strawberryblondesmarketsummary.com/
