
There were too many charts to cover in a single post today really so I split off the interesting USD/forex setup into a separate post yesterday that you can see here. As I mentioned there, short term USD is looking as though it may break up and EURUSD looks ready to break down, though it's worth noting that since then EURUSD has made a marginal new low on positive RSI divergence. If EURUSD breaks back above broken rising channel support we may see a decent oversold bounce.
On equities the long setup is looking distinctly shaky short term, and it's worth remembering here that many swings start with a counter-trend spike followed by a bigger move down. On the ES 60min the high on Friday was well short of the IHS target in the 1382 area, but the 60min RSI is showing negative divergence, the initial support trendline from the low broke last night, and we have a short term lower high. I have support at 1360 and strong support at 1351.75. A break below 1351.75 would suggest a retest of last week's lows:

The setup on NQ looks similar, with the same negative RSI divergence, support trendline break and lower high. Definitely some room for caution here:

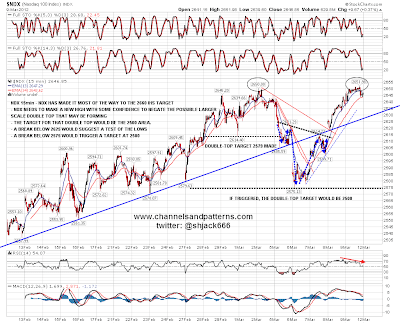
Looking at the NDX chart from last week, the NDX high on Friday was just 8 points short of the 2660 target, which might be close enough, and there is a nice looking double-top in place. Support is at 2625 and last week's low at 2575. A break below last week's low would trigger a double-top target in the 2500 area. Worth noting is Bulkowski's statistic however that 65% of double-tops fail before they trigger by going below the low of the valley between the tops. Double-tops are ONLY a high probability pattern after they break that valley low, however nice they might look:
There was a strong move up on TRAN after last week's low and it is close to testing wedge resistance. I'm doubtful about that pattern breaking up before a more definite retracement on equities, so that is a possible limitation on upside this week:

ZB hit my downside target perfectly on Friday and bounced there. I was looking at possible declining resistance in the 140'26 area but that has broken since I capped the chart below. The short term trend on bonds is therefore upwards at the moment:

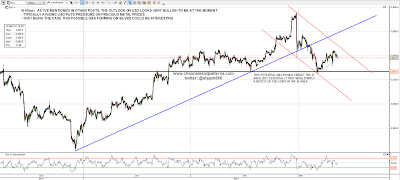
Last chart for today is silver. I'm still very much a long term precious metals bull but I was talking about the strongly bullish setup on USD yesterday, and a big move up on USD might well be accompanied by a retracement or sideways trading on PMs. With that in mind this potential H&S forming on silver looks interesting:
Overall the setup on equities looks weak coming into opex week. Whether any weakness will amount to much is an open question. but we'll see whether the bears can produce anything more than the usual first hour low this morning. On the bulls side they need to hold ideally 1360 but more definitely 1351.75 on ES (June) and trendline support in the 2625-30 area on NDX. Stock Traders Almanac has Dow up 17 of the last 24 on the Monday of Opex week.
