
Further to my
last weekly market update, this week's update will look at 6-month
Daily charts and 1-Week graphs of:
- + 6 Major Indices
- + VIX
- + 9 Major Sectors
- + Germany, France and the PIIGS Indices
- + Emerging Markets ETF and the BRIC Indices
- + Canada, Japan, and World Market Indices
- + Commodity and Agriculture ETFs, Gold, Oil, Copper, and Silver
- + 7 Major Currencies
On each of the
Daily charts are a 20 (blue) and 50 (red) sma. I'll be referring to
these as providing either short-term (20 sma) or medium-term (50 sma) support or
resistance relative to Friday's closing price, as well as identifying current
trend. I will not be referring to overbought or oversold conditions in this
particular post; rather, it will be a very simple analysis of where these
instruments are relative to these moving averages and current trend for the past
six months.
The graphs show percentage gained/lost for
each instrument during the past week.
6 Major
Indices:
Basically, the 20 sma is providing short-term support
for the Dow 30 and S&P 500, which are the leaders within this group. The 20
sma is serving as short-term resistance for the Nasdaq 100 and Russell 2000, and
these are lagging the first two indices…they will need to regain and hold
above the 20 sma to support any further rally in the Dow 30 and S&P 500. The
Dow Utilities needs to see the 20 cross and hold above the 50 sma before I'd
conclude that it has returned to a full-uptrend status. The Dow Transports is
the group laggard and also needs the 20 to cross above the 50 sma, plus a price
break and hold above the 5200 level before I'd consider it to have begun a
new uptrend.

the graph below, the Dow Transports was the biggest gainer, while the Nasdaq 100
and Russell 2000 had the smallest gains…ones to watch to see if strength
continues to build in these in support of any further rally in equities, in
general.

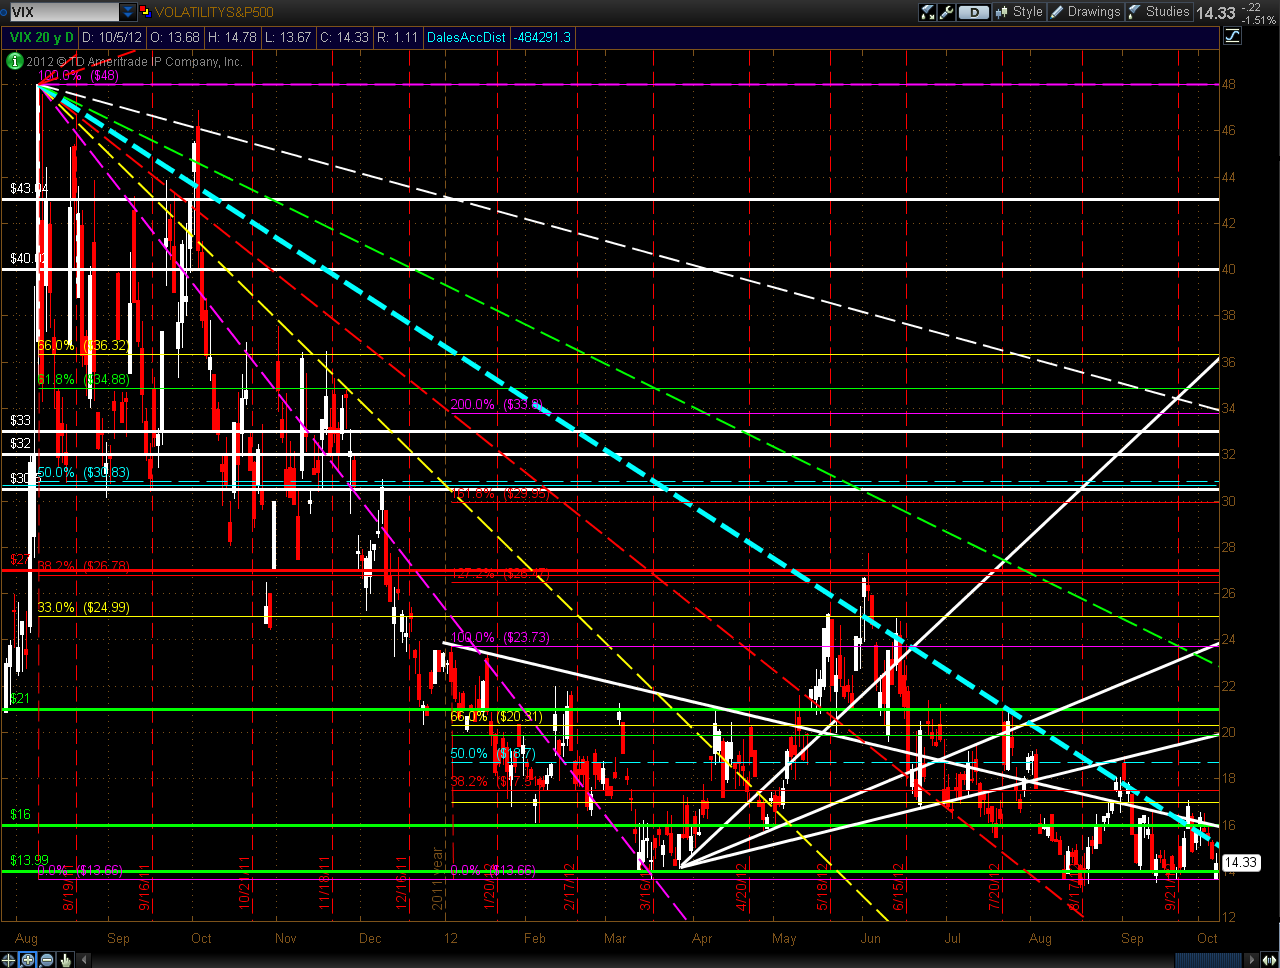
from a triple-bottom bounce (from mid-August), as shown on the
Daily chart. It's at lows not seen since 2007, and will need to
close and hold above 17.00 to signal that a reversal may be starting on the
SPX.
Sectors:
-
All of them, with the
exception of the Utilities sector, are in uptrend. -
Above their 20 sma
are XLY, XLI, XLB (just), XLP, XLV, and XLF…20 sma = near- term support. -
In between their 20
and 50 smas are XLK and XLE…20 sma = near-term resistance. -
In uptrend and above
the rising 20 but falling 50 smas is the XLU…it needs to see the 20 cross and
hold above the 50 sma before I'd conclude that it has returned to a full-uptrend
status.

the graph below, the Financials were the biggest gainer, followed by Healthcare,
and Consumer Staples. Energy and Technology were the smallest gainers and are
the ones to watch to see if they regain and hold above their 20 sma.

France and the PIIGS Indices:
in uptrend. However, France is the biggest laggard, relative to both smas.
France is the one to watch to see if it weakens further, or whether it can make
a higher high to continue in uptrend (it made a lower low, so a higher high is
necessary next). Greece is the only one that broke and closed above recent
highs.

the graph below, Greece was the largest gainer during the week and is the one to
watch for evidence of continued strength.

Markets ETF (EEM) and the BRIC Indices:
With the exception of
China, they are, generally, in uptrend. India is the leader of this group and
the one to watch for continued strength above its 20 sma. Brazil is lagging and
will need to regain and hold above both smas, and Russia will need to regain and
hold above the 20 sma. China will need to see the 20 cross and hold above the 50
sma and make a series of higher highs/lows before a reversal of the downtrend
can be considered to have begun…it has not yet stabilized and is still in
downtrend, with the 50 sma holding as medium-term resistance.
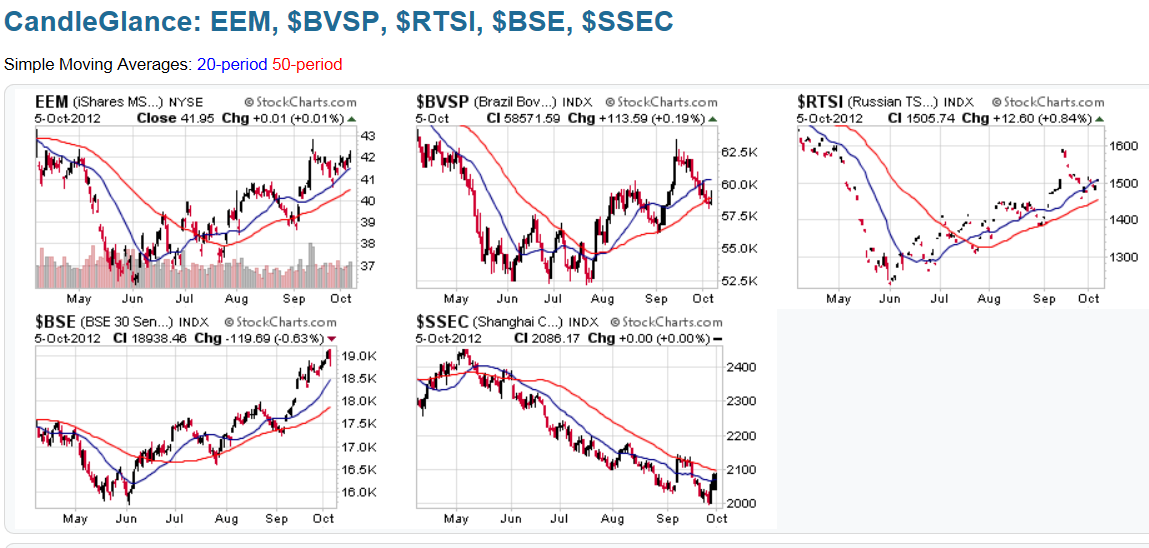
As can be seen from
the graph below, Russia was the biggest gainer, followed by EEM and India.
Brazil was the loser. China was closed this past week for a holiday.

Canada, Japan
and World Market Indices:
Canada and the World Market indices
are in uptrend, with the 20 sma providing near-term support. Japan is in a
slight uptrend, but price is currently below both smas and will need to regain
and hold above both before I'd consider it to be in a viable uptrend.

As depicted on the
graph below, the largest gainer was the World Market index, followed by Canada.
Japan was, basically, flat and will need to firm up, as mentioned above.

Commodity
(DBC) and Agriculture (DBC) ETFs, Gold, Oil, Copper, and
Silver:
- DBC is caught in between its 20 and 50 smas…the 50 sma is, essentially at
the neckline of a potential Head & Shoulders pattern. - The 20 has crossed below the 50 sma on DBA, and it is threatening to move
into a downtrend…a lower low will confirm that. - Gold is in uptrend, with the 20 sma serving as near-term support.
- The 20 has crossed below the 50 sma on Oil, and it is in a very tight-ranged
downtrend. - Copper is in uptrend, with the 20 sma serving as near-term support.
- Silver is in uptrend, with the 20 sma serving as near-term support.

As shown on the graph
below, Oil was the biggest loser, followed by Agriculture and Commodities…ones
to watch for signs of further weakness, which may pull equities down, as well.
Gold, Copper, and Silver will need to hold above their respective 20 sma, lest
they drop to their 50 sma medium-term support levels.

7 Major
Currencies:
- The U.S. $ is attempting to stabilize, but has closed just below its 20 sma
and is still in downtrend. - The Euro and Swiss Franc were the only two that closed above their 20 sma
and are still in uptrend. - The Canadian $ closed just below its 20 sma, but is still in uptrend. It
will need to regain and hold above the 20 sma to resume its uptrend; otherwise,
we may see it drop and hold below the 50 sma. If Canada's Index drops further,
along with Oil and Gold, the Canadian $ will likely follow suit. - The Aussie $ has had a couple of large swings below both smas and is now
threatening to make a lower low and send it into downtrend. The 20 has crossed
below the 50 sma, as well. - The British Pound is still in uptrend, but closed below its 20 sma. It will
need to regain and hold above the 20 sma to resume its uptrend; otherwise, we
may see it drop to its 50 sma. - The Japanese Yen has not made a higher high and will need to in order to
resume its uptrend.

As shown on the graph
below, the Aussie $ was the biggest loser this past week, followed by the Yen
and U.S. $. The Euro was the biggest gainer, followed by the Swiss Franc, and
Canadian $. What happens with the Greek and French indices next week may have a
bearing on the Euro in the short term.

As an addendum to the
above currencies, a resolution of China's downtrend will need to take place
soon, lest we see the AUD/CAD forex pair continue downward, as
mentioned in my earlier post on Friday. I would note that price closed
below the neckline of a large potential Head & Shoulders pattern on its
Weekly chart at 0.9969. The measured move target of 700 pips would,
ultimately, take price down to 0.93.
In
summary, China's Shanghai Index and AUD/CAD are important instruments
to watch next week, along with the Nasdaq 100, Russell 2000, Financials ETF
(XLF), France, Greece, India, Brazil, Canada, Japan, Commodities ETF (DBC),
Agriculture ETF (DBA), Gold, Oil, Copper, Silver, U.S. $, Euro, Aussie $, and
Canadian $.
Enjoy your weekend and good luck next week!
SB's DISCLAIMER: The
information contained within my posts may not be construed as financial or
trading advice. Please do your own due diligence before engaging in any trading
activity.
