
I have to say that yesterday was one of the strangest trading days that I have seen in a while. EURUSD and CL broke down very hard in the morning, TLT made new short term highs and filled a big gap, and equities traded sideways to up, delivering clear bullish short term trendline breaks in the afternoon. Yesterday was a very bad day for intermarket correlations and while I am leaning long today, the risk of downside failure looks unusually high.
Both of the ES and SPX declining channels broke up yesterday, and that should indicate towards at least a retest of the recent highs. It's important to remember that we still have falling wedge and IHS targets in the 1433/4 area and we may see a push up to make those targets. Here's the setup on the SPX 15min chart:

On the SPX daily chart the upper bollinger band is in the 1432.25 area, a good fit with those pattern targets on the SPX 15min chart at 1433/4. Immediate resistance is at the 50 DMA at 1417.5. SPX has been consolidating well above the middle bollinger band or 20 DMA and that is also a reason to lean bullish overall here:

The ES declining channel broke up yesterday as I mentioned, and a poor quality ascending triangle has formed. A decent quality ascending triangle has multiple crosses between the trendlines of course and this does not. This looks cautiously bullish however on a break over 1315, and overnight support has clearly been at the 1310 support level. It's worth mentioning that triangle support is the rising support trendline from the low, and that has been breaking intra-hour in recent hours. An hourly close below 1310 would make this setup look considerably less bullish:

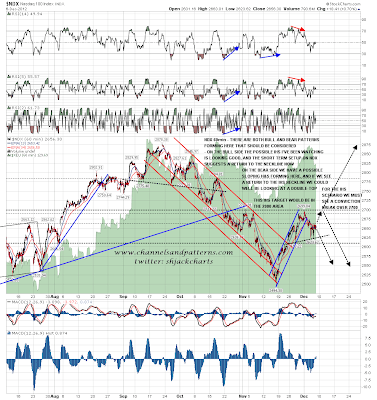
The setup on NDX looks very ambiguous here, with both bull and bear patterns in play. On the short term bull side NDX broke declining resistance from the high yesterday and a nice looking double-bottom has formed with a target back at the recent highs on a conviction break over 2660. On the bear side there is an obvious upsloping H&S in play, and the ideal right shoulder high would obviously be in the 2660 area at the highs yesterday. On a clear break below 2625 the H&S target would be in the 2540 area to fill the larger gap below from the break up from the mid-November low. This setup needs to be resolved with a clear break one way or the other:
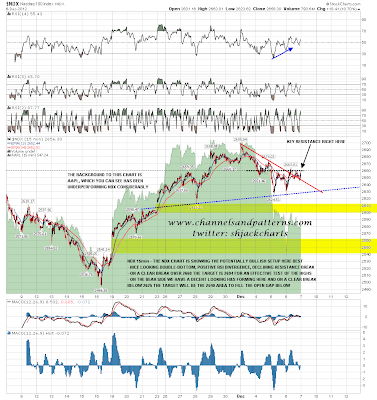
The bull and bear patterns are also clear on the NDX 60min chart. If we see a move back up to the 2700 area that would complete the possible bullish IHS that I have been looking at for over a week now, and then a conviction break over 2700 would target the 2900 area, above the September highs. This is the key Xmas rally pattern if we are going to see that rally. A rally to the 2700 area and failure there would set up a double-top indicating back to the 2525 area, effectively for a test of the November low, and a conviction break below the 2625 area from here would trigger the 2540 target that I was looking at on the 15min chart:
As I mentioned, there was a strong break down on EURUSD yesterday and the rising channel there is very broken. The obvious downside target is in the 1.2875 – 1.2885 support range and that area is most definitely a possible H&S neckline. In recent days a lot of well known chartists have been posting the H&S forming on DX that I have been following for the last few weeks, but as I mentioned the other day looking at the left shoulder, the right shoulder could take several more weeks to peak at a level that could be significantly higher than the last peak.
This means that we could see the November lows on EURUSD tested or undercut within that overall H&S setup on DX. I'll be watching the 1.2875 to 1.2885 area on EURUSD carefully, and an H&S forming there could play out even if USD is going to tank over the next year.

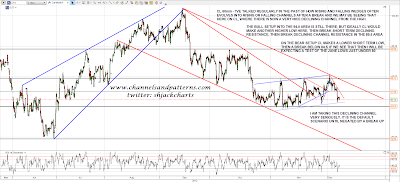
I have been watching the nicely bullish looking setup on CL for some weeks now but I've seen something this morning that makes the chart look much more bearish. Obviously a falling wedge broke up about three weeks ago, and that was a decent bull pattern. As I've mentioned regularly before however, both rising and falling wedges can evolve into channels, and this CL falling wedge may well have done that. A declining channel has now been established that needs to be respected until it breaks up.
I have put the bull and bear trigger levels on the chart in detail but key support is now at 84.5, with a conviction break below targeting the June lows under 80. On a break above channel resistance, now at 89.5, the upside scenario into the 94.5 area should deliver. These are big moves and this could go either way, with a bias towards the bear side while the declining channel remains unbroken. Short term CL is still making higher lows and highs with the last low just over 85.3 still holding:
I am very cautiously leaning bullish on equities today as we saw clear bullish trendline breaks yesterday on ES, SPX and NDX. However the intermarket setup doesn't look good here, and I am not assuming that the lack of correlation we saw yesterday will last long. I have rarely felt less convinced that bullish trendline breaks can deliver. I'll be watching the NDX chart closely over the next few days as the clearest trigger levels into a test of the September highs or the November lows are on that 60min chart. Clear breaks on that chart should be respected into their respective target areas marked on the chart.
