
The move up this week hasn’t gone quite as I expected. As I said on Monday morning, there were and are 90% odds that the triangle that broke up on Friday would make a thrust out that would be fully retraced within days back to, depending on the draw, at least the 2080-5 area. I was expecting that retrace on Monday or yesterday, to be followed by another move up, but it hasn’t happened yet.
There is obviously a 10% chance that the triangle retrace won’t happen of course, but 90% odds are really pretty high so I’m assuming that we will see that retracement until demonstrated otherwise.
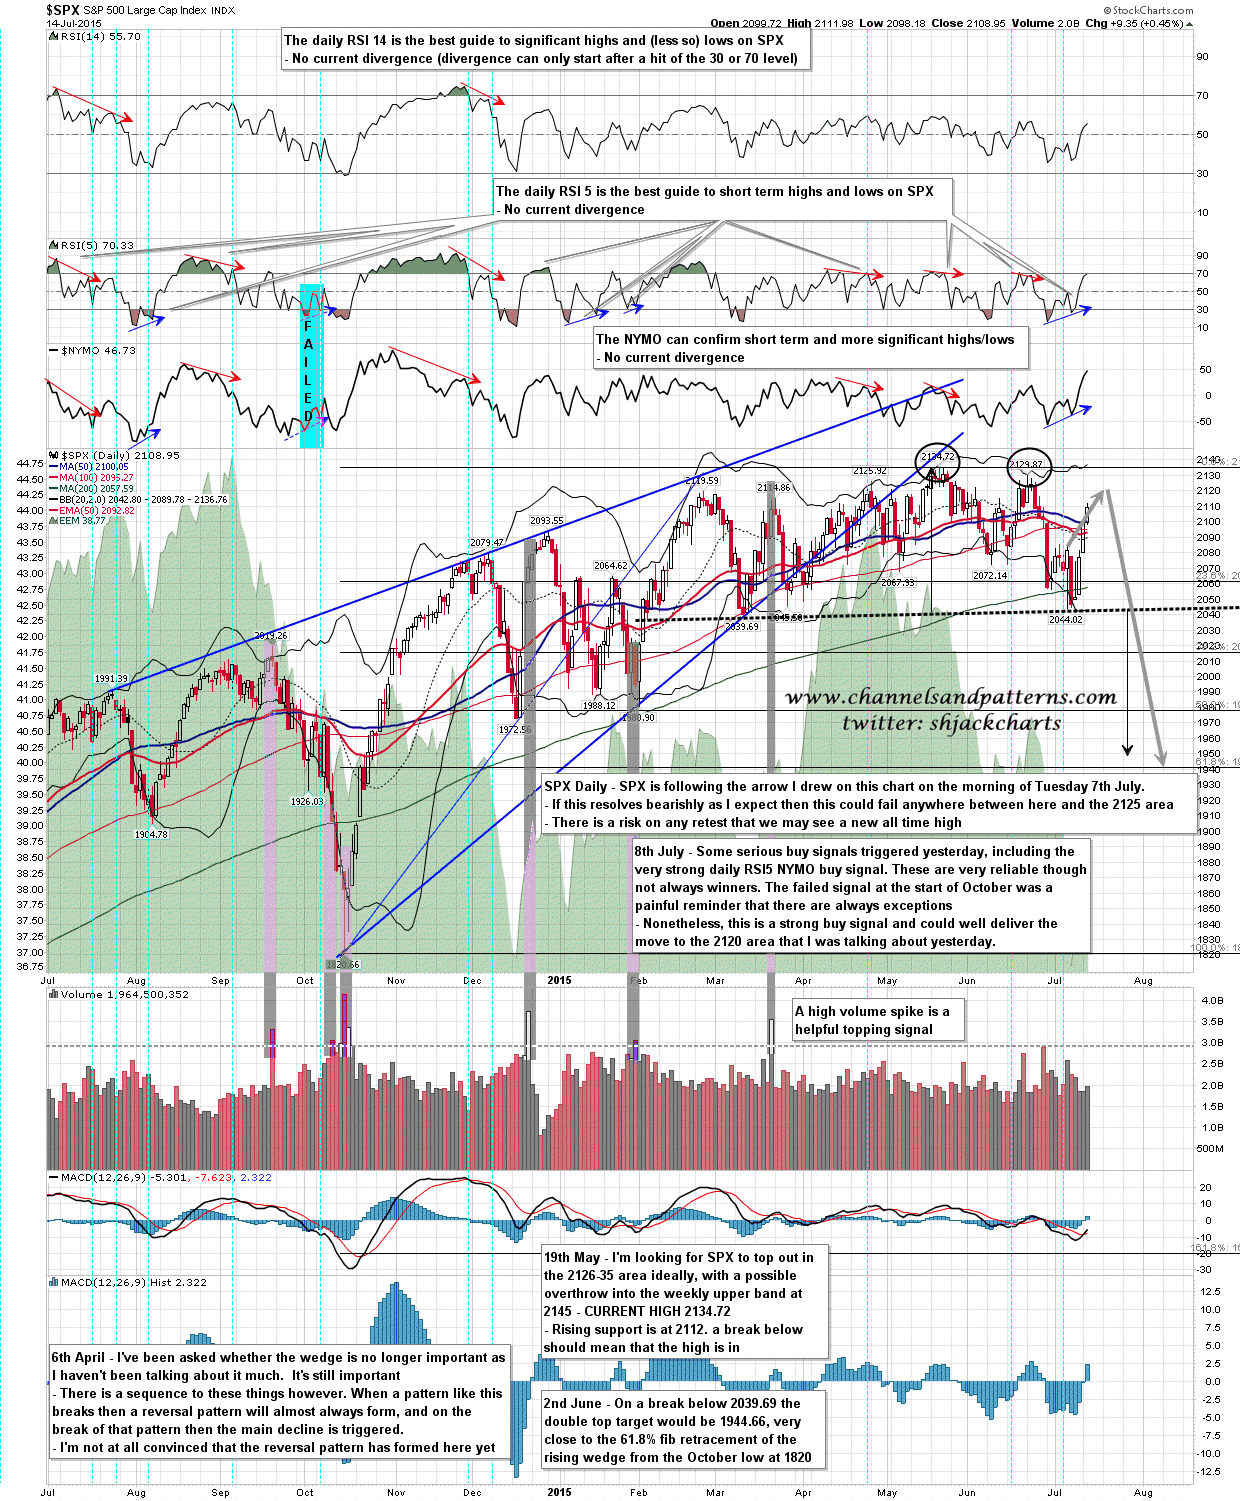
On the daily chart, the RSI5_NYMO buy signal made target yesterday and if we are to see a retracement then the obvious target is a retest of the daily middle band in the 2090 area. On a bull scenario we would go through that intraday and close the day back over it. On the bear scenario SPX would close back under the middle band, and not come back anytime soon. SPX daily chart:
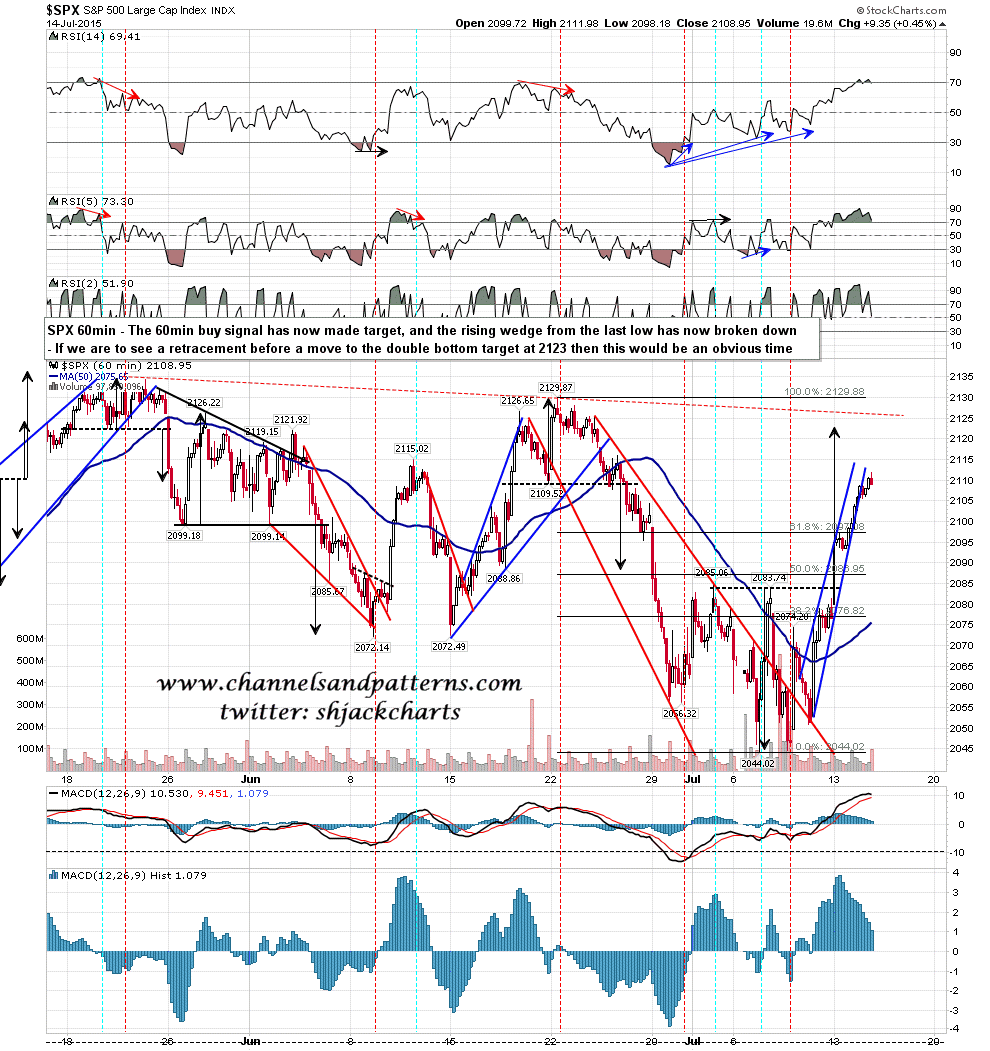
The 60min (RSI 14) buy signal also made target yesterday, and some weakness this morning would fix a 60min RSI 5 sell signal. SPX 60min chart:
On the 15min chart the thrust up from the triangle appears to be topping out or to have topped out, and there is a very clear 15min sell signal. On the optic run charts I showed yesterday all of them had broken rising support by the end of the day, and NDX and RUT had both also made their double bottom targets, though SPX and Dow were both still short of theirs and TRAN looked very unlikely to make the one there. SPX 15min chart:
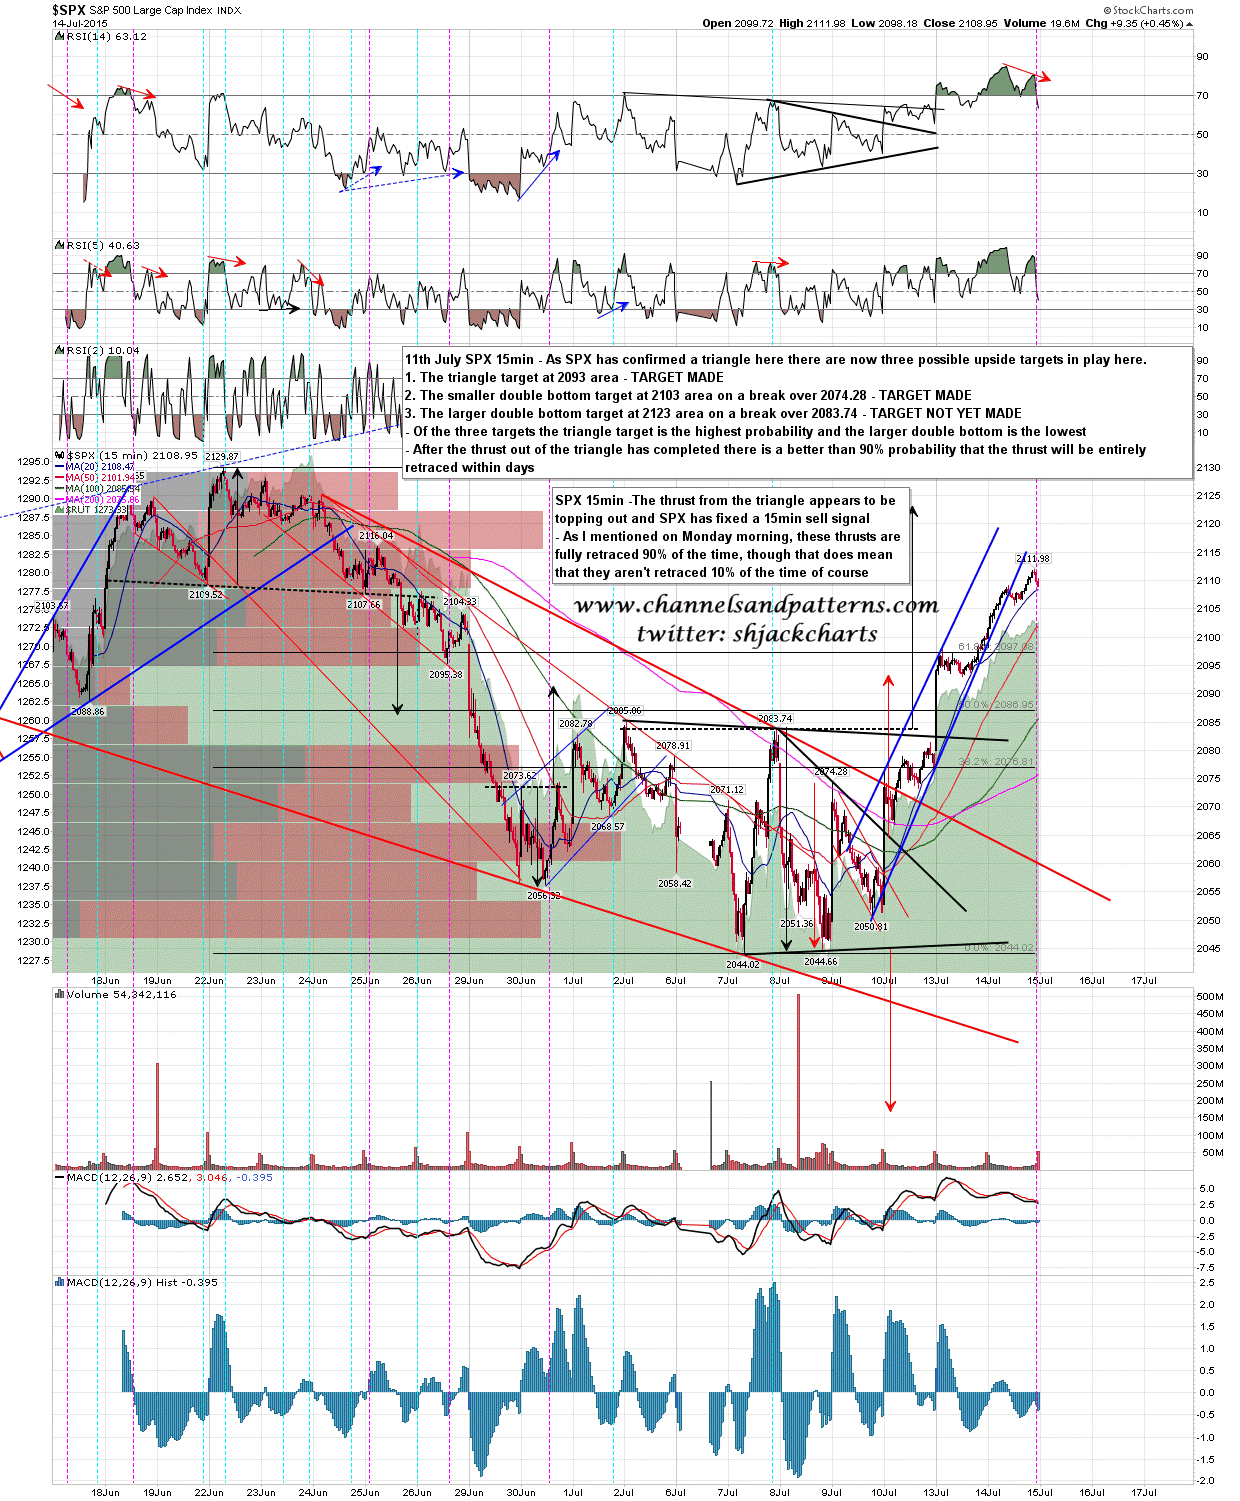
I’m looking for a consolidation or retracement day today and if a retrace gets going then I’ll be looking for a move to the 2080-5 area. A hard support fail there that lasted into the close would be very bearish. a hold of the daily middle band at the close would be cautiously bullish, though bulls need to make a new all time high to open up higher targets.
This is an inflection point, and my lean is towards a bearish resolution. There’s a lot of talk that a new move up is starting and that might be right, though there is still very strong resistance in the 2200 area that is very unlikely to break whatever happens here. The truth is though that so far this week anything unexpected has been in the finer details, and there has been no major deviation from the roadmap to a retest of 2120 that I laid out on the morning of Tuesday 7th July. The arrows I drew for that scenario are on the daily (first) chart in this post and I haven’t moved those arrows since. That was an overall bearish scenario.
