Slope of Hope Blog Posts

Slope initially began as a blog, so this is where most of the website’s content resides. Here we have tens of thousands of posts dating back over a decade. These are listed in reverse chronological order. Click on any category icon below to see posts tagged with that particular subject, or click on a word in the category cloud on the right side of the screen for more specific choices.

Fed Stimulus “Canaries” About to Croak?

By -

I last wrote about the Fed Monetary Stimulus “Canaries” in my post of December 16, 2014. As a reminder, I chose six of them (ETFs) in order to determine their relative strength/weakness against their respective Stock Market Index, since they may have held clues for further accumulation in riskier assets due to respective Central Bank stimulus programs.

So that we can compare their current relative strength/weakness, I’ve provided the following 5-Year Daily ratio charts for each “Canary.”

OBSERVATIONS

(more…)

Macrocosm

By -

Below is the opening segment of this week’s edition of Notes From the Rabbit Hole, NFTRH 353. After this theoretical exercise we got down to nuts and bolts analysis, which provided logical ‘bounce’ targets (provided a bounce is indeed what is in play) for Gold, Silver and HUI, a compelling trend in the Commitments of Traders data and more talk about the trends that will need to be in place before a favorable macrocosmic environment is in place for the gold sector.

Not one to obsess on the gold sector in a vacuum, NFTRH also covered US and global stock markets, commodities, macro indicators and currencies as usual.

Macrocosm

macrocosm

(more…)

Eye on Shanghai vs SPX Chart

By -

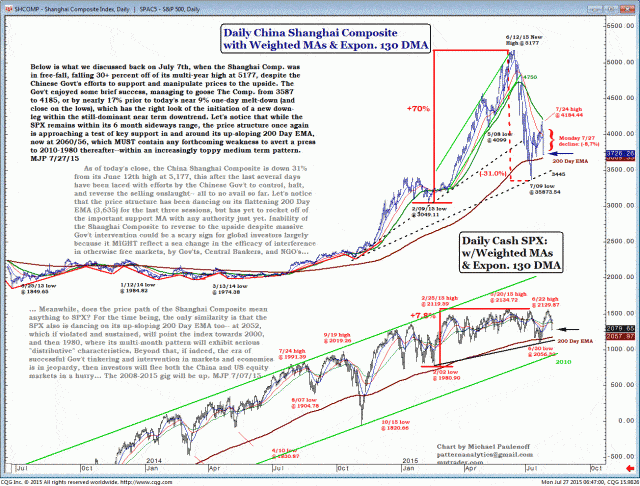
After the Shanghai Composite’s July 9 low, the Chinese government enjoyed some brief success, managing to goose the index from 3587 to 4185, or by nearly 17% — until today, that is. The index melted down nearly 9%, closing on the lows, and has the right look of the initiation of a new down-leg within the still-dominant near-term downtrend.

Meanwhile, the S&P 500 remains within its 6-month sideways range, although the price structure once again is approaching a test of key support in and around its up-sloping 200-Day EMA, now at 2060/56. That level must contain any forthcoming weakness to avert a press to 2010-1980 thereafter–within an increasingly-toppy medium-term pattern.

full-d42d582e67325109702815b8b582dfdbda7a9ca9Originally published on MPTrader.com.

What Do You Get?

By -

Today was terrific – except for one thing: my long positions.

After Friday’s success with gold, I decided to get cute and buy miners, as well as some oil producers, and even some oil. Almost without exception, every one a loser, and in the end, nothing more than a substantial tax on my marvelous bearish profits.

And in my head I can only think of one song – – shown below – – whose lyrics I have renamed “I’ll never buy a stock again………