Slope of Hope Blog Posts

Slope initially began as a blog, so this is where most of the website’s content resides. Here we have tens of thousands of posts dating back over a decade. These are listed in reverse chronological order. Click on any category icon below to see posts tagged with that particular subject, or click on a word in the category cloud on the right side of the screen for more specific choices.

Wad Shot

By -

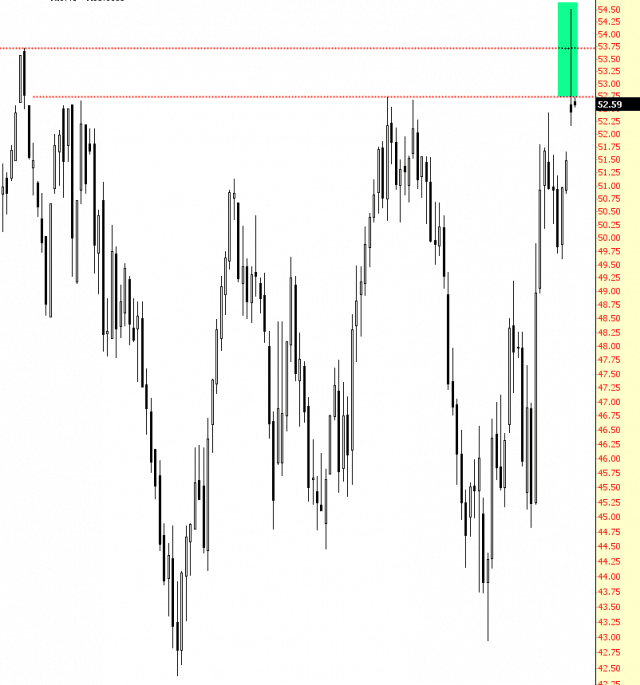
I’d say that crude oil shot its wad during the Sunday-Monday session. All the good news that crude could have enjoyed came out:

  • OPEC agreement, the first in 8 years;
  • Non-OPEC nations agreement, the first in well over a decade;
  • Saudi Arabia announcing it would cut even farther than already pledged

Thus, crude oil spiked huge………..and then faded all day. The tremendous green “shadow” on that candlestick is like a spike through the hearts of crude oil traders dreaming of the stuff going to the 60s. This is a failed bullish breakout par excellence.
1212-shotwad

Buy and Hold!

By -

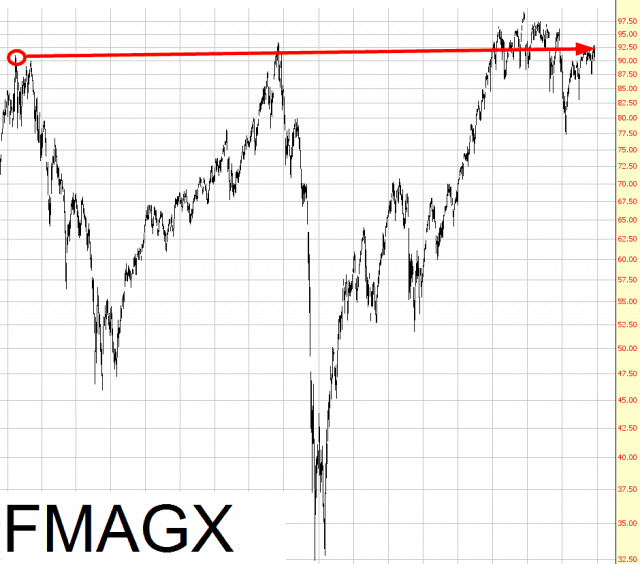
It’s no surprise that a huge theme these days is the wisdom of “buy and hold” (in other words, Warren Buffet-style, never-sell-anything investing). Out of curiosity, I decided to look at a chart I hadn’t had reason to examine in years: that of fabled mutual fund Fidelity Magellan, once led by the mythic Peter Lynch.

What struck me is that, over a period of about 17 years, the fund has basically gone nowhere. I’ve compared the market two bubbles ago (yeah, that’s how I’m measuring time these days) with the present, and as you can see, you would have had to stomach two gargantuan drawdowns, each of which was followed by a Fed-driven rally. And, in the end, you wouldn’t have budged.

1212-fidelity

When I tweeted this out, apologists for FMAGX said I wasn’t including dividends. I can’t say for sure, but I’m pretty positive that this chart takes dividend adjustments into account.

(more…)

Canary In A Coal Mine

By -

I posted the RUT 60min chart on Friday morning showing RUT testing a decent looking rising wedge resistance trendline and obviously expecting that to hold. If you were just watching SPX and NDX over the rest of the day you might well have assumed that the RUT wedge resistance was demolished by the bulls, but actually it held, and anyone shorting RUT from the Friday morning high had a pleasant if unexciting day.

What does this mean? Well firstly it’s a reinforcement of something I mention regularly, in that correlations are hit and miss for trading purposes. If I think USD is headed higher I won’t short GC, as the inverse correlation might fail even if I’m right about USD. I would always go long USD & cut out the middleman. That’s why I didn’t short ES on Friday because TF was hitting serious resistance, I shorted TF & had a pleasant day.

(more…)