I mistakenly said last week that our monthly free public Chart Chat was last Sunday. It is actually next Sunday, so if you’d like to register for that, you can do that on our May Free Webinars page.
The NQ triangle broke up last week and ES broke up from declining resistance and back over the daily middle band. The short term low is likely made and ES/SPX has been backtesting broken resistance.
There is some scope to go lower, with the obvious support levels on ES at the weekly and monthly pivots, at 2645.5 and 2639 respectively, but these look like bull flags forming so far, and SPX has come close to a test of short term support at the 50 hour MA at 2653. That may be close enough. Partial Intraday Video from theartofchart.net – Update on ES, NQ and TF:
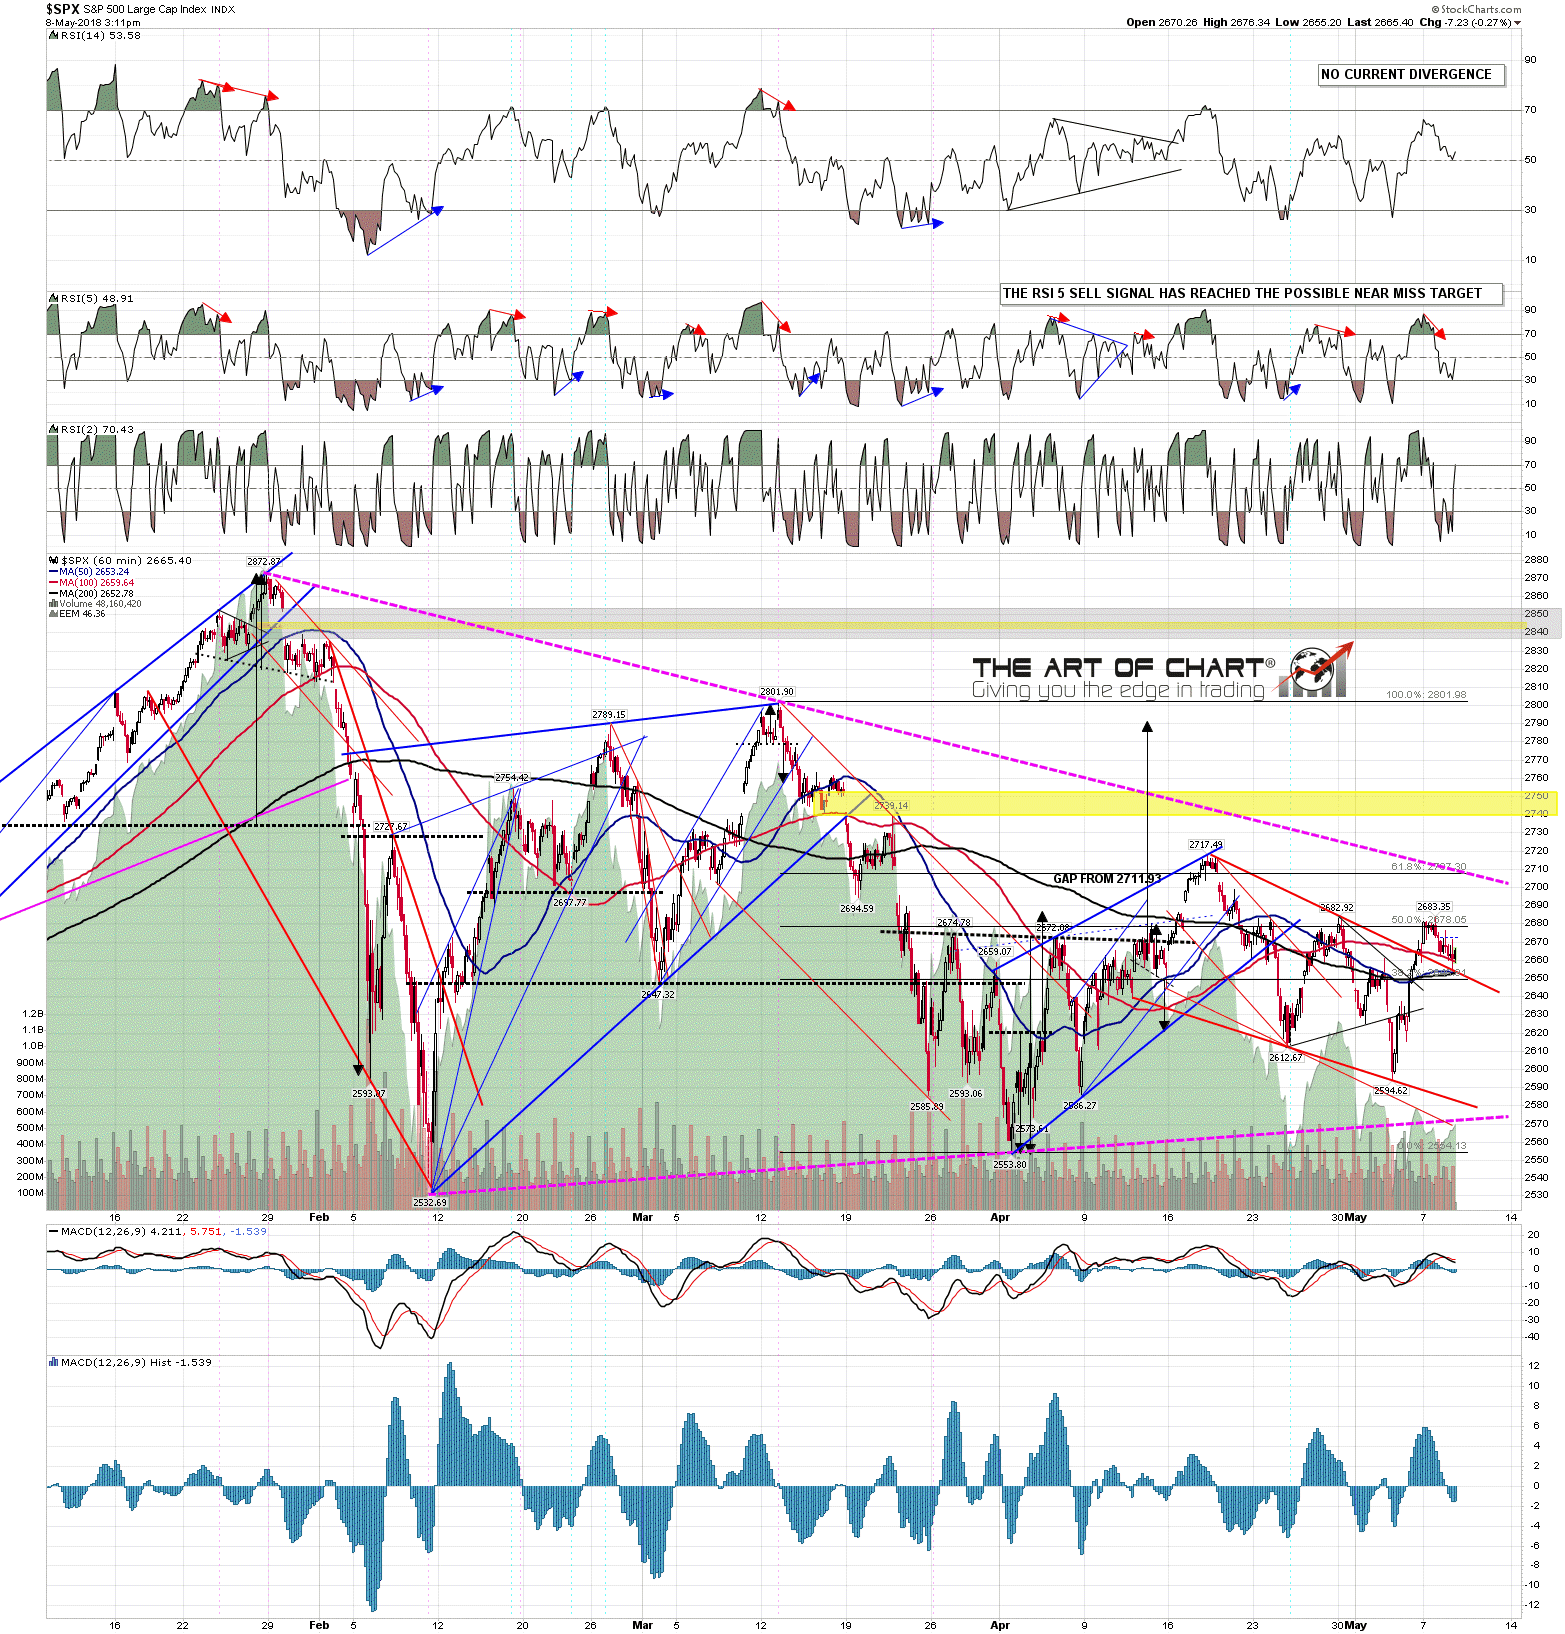
Not far above is declining resistance from the all time high, also triangle resistance, now in the 2710 area. A break and conversion of that to support opens the path to a possible ATH retest, but it’s important to remember that has not been broken yet, and it’s possible that it might not break when tested. SPX 60min chart: