Slope of Hope Blog Posts
Slope initially began as a blog, so this is where most of the website’s content resides. Here we have tens of thousands of posts dating back over a decade. These are listed in reverse chronological order. Click on any category icon below to see posts tagged with that particular subject, or click on a word in the category cloud on the right side of the screen for more specific choices.
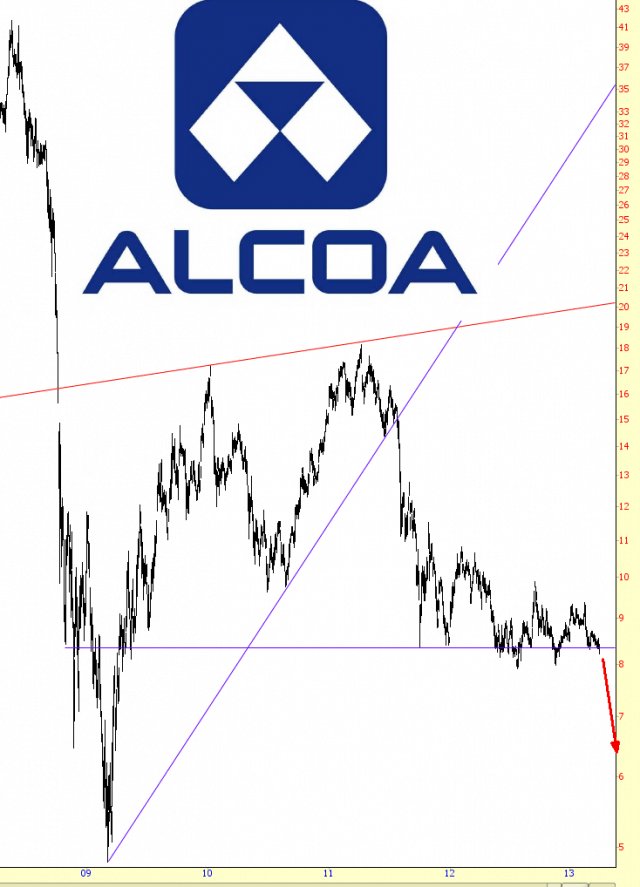
Testing the 2007 High
The high on SPX yesterday was at 1573, just shy of the intraday 2007 high at 1576.09. I was saying to a friend yesterday morning that the ideal place for a high here, if we are going to see a high here, is at 1576 plus or minus 4, and we hit that yesterday, but ideally we would see the high tested and slightly exceeded. This is the last chance to see a reversal at an established resistance level, as above 1576.09 is blue sky territory.
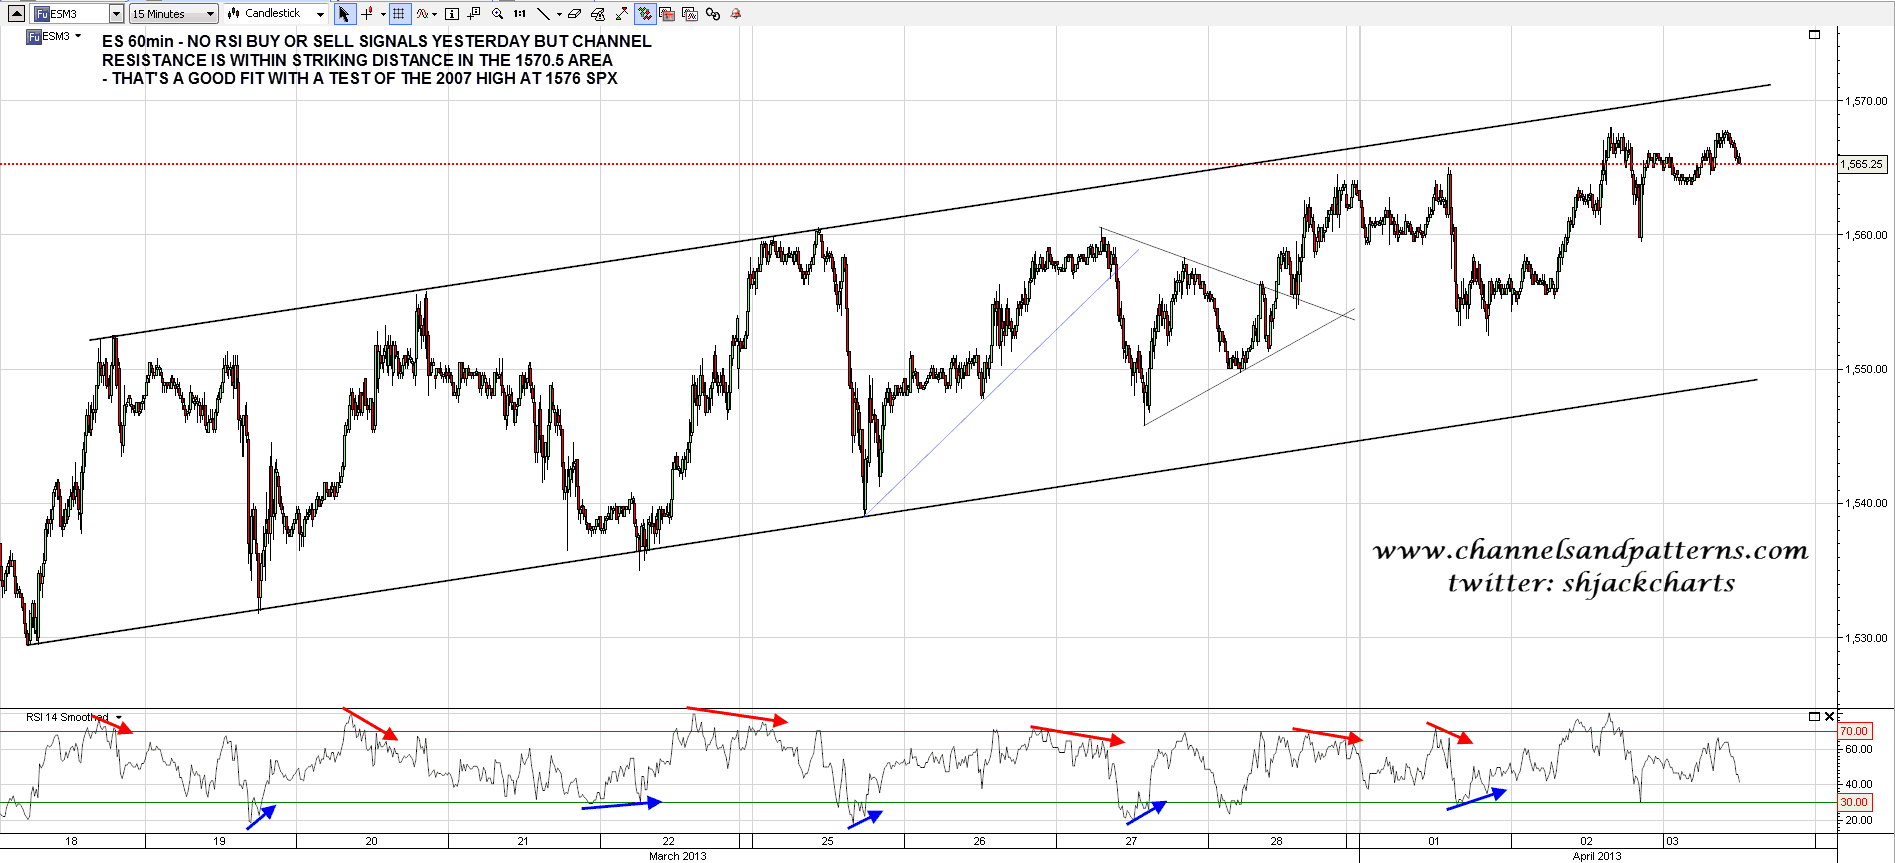
On ES there were no RSI signals yesterday, but ES is within striking distance of channel resistance in the 1570.5 area, and that is a decent fit with a test of the 2007 high on SPX:
(more…)
Waiting for the Fat Lady to Sing
The rally from the Nov 2012 lows appears to be in wave 5, or i suspect it will be a 5 wave advance.
In Elliott Wave terms we call that an impulse wave, it looks virtually text book, although as its pushing higher, it still don’t look completed, I am currently working 2 ideas.
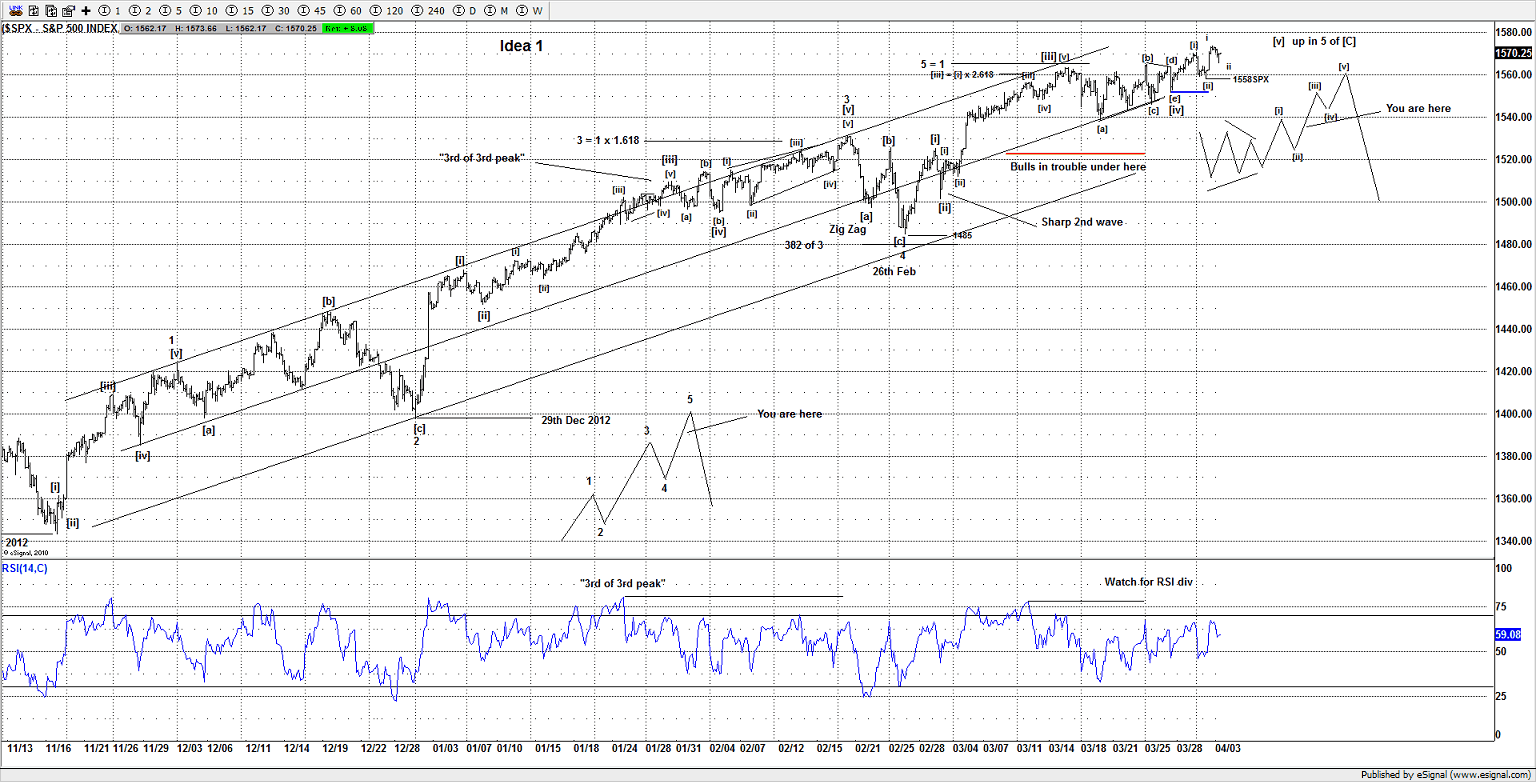
Idea 1
The market is about to push higher in a small 3rd wave of what we call a triangle “thrust”, so today should see more upside above 1581SPX, so some sort of “burst” to confirm this idea and negate Idea 2.
Holding above 1558SPX keeps the market bid, so no matter which idea, it is still bullish above that area, and short term aggressive traders can look to buy dips and use 1558SPX as the risk control point.
A potential target for the end of wave 5 is around the 1590-1600SPX, but its subject to wave structure and counting a 5 wave advance from the wave [e] point of the triangle (blue line).
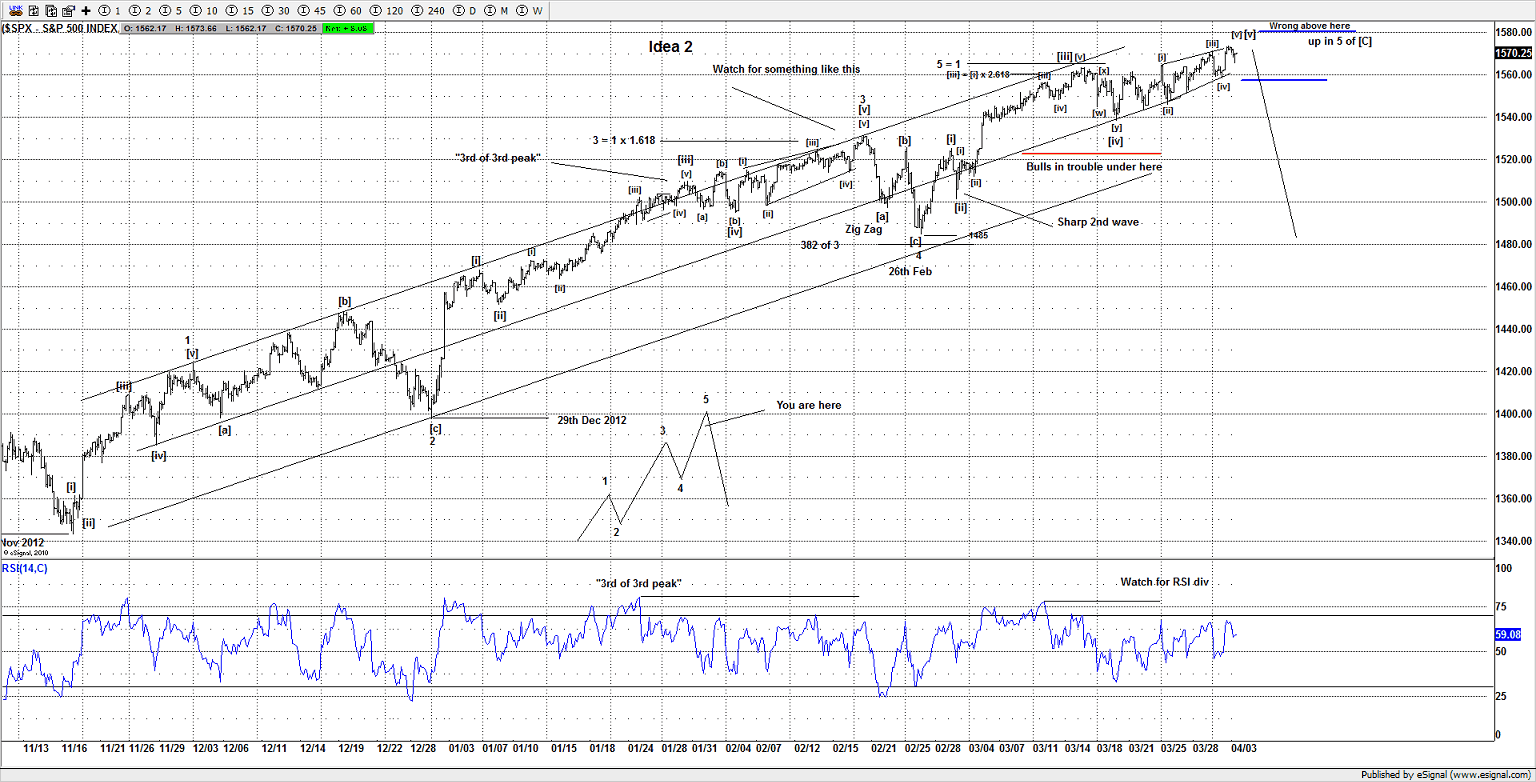
Idea 2
This is the preferred idea and a potential ending diagonal (non Elliotticians call them bearish wedges).
Although this is limited to 1581SPX as above that area wave [v] would be longer than wave [iii] and that’s a rule violation for the pattern, so its actually quite simple, if a move above 1581SPX, it suggests Idea 1 and the triangle “thrust” option is working, failure to break above 1581SPX suggests the ending diagonal option.
Currently the market has not tipped its hand, but by the end of today’s close i am expecting to have some sort of edge to which idea is working.
No matter which idea as long as its above 1558SPX the market is still bid.
I wont bore you with the daily chart idea, as that is not important, whats important is the structure appears to be a 5 wave move from the Nov 2012 lows and i suspect a reversal is close, we simply need to let the market commit and confirm which short term idea is in play.
