We are doing our monthly free public Chart Chat on Sunday. If you’d like to attend you can sign up for that on our July Free Webinars page.
SPX reached the ideal 2680-2700 retracement low range and has rallied strongly from there with a 60min RSI 14 buy signal fixing this morning. The low isn’t definitely in yet, with resistance at the 50 hour MA and daily middle band above in the 2737 and 2756 areas respectively, but this is a very strong candidate low, with a decent double bottom setup here meaning that there would be no need to retest the low as part of a bottoming process. We’ll see how that goes.
Partial Premarket Video from theartofchart.net – Update on ES, NQ, SPX, NDX, RUT:
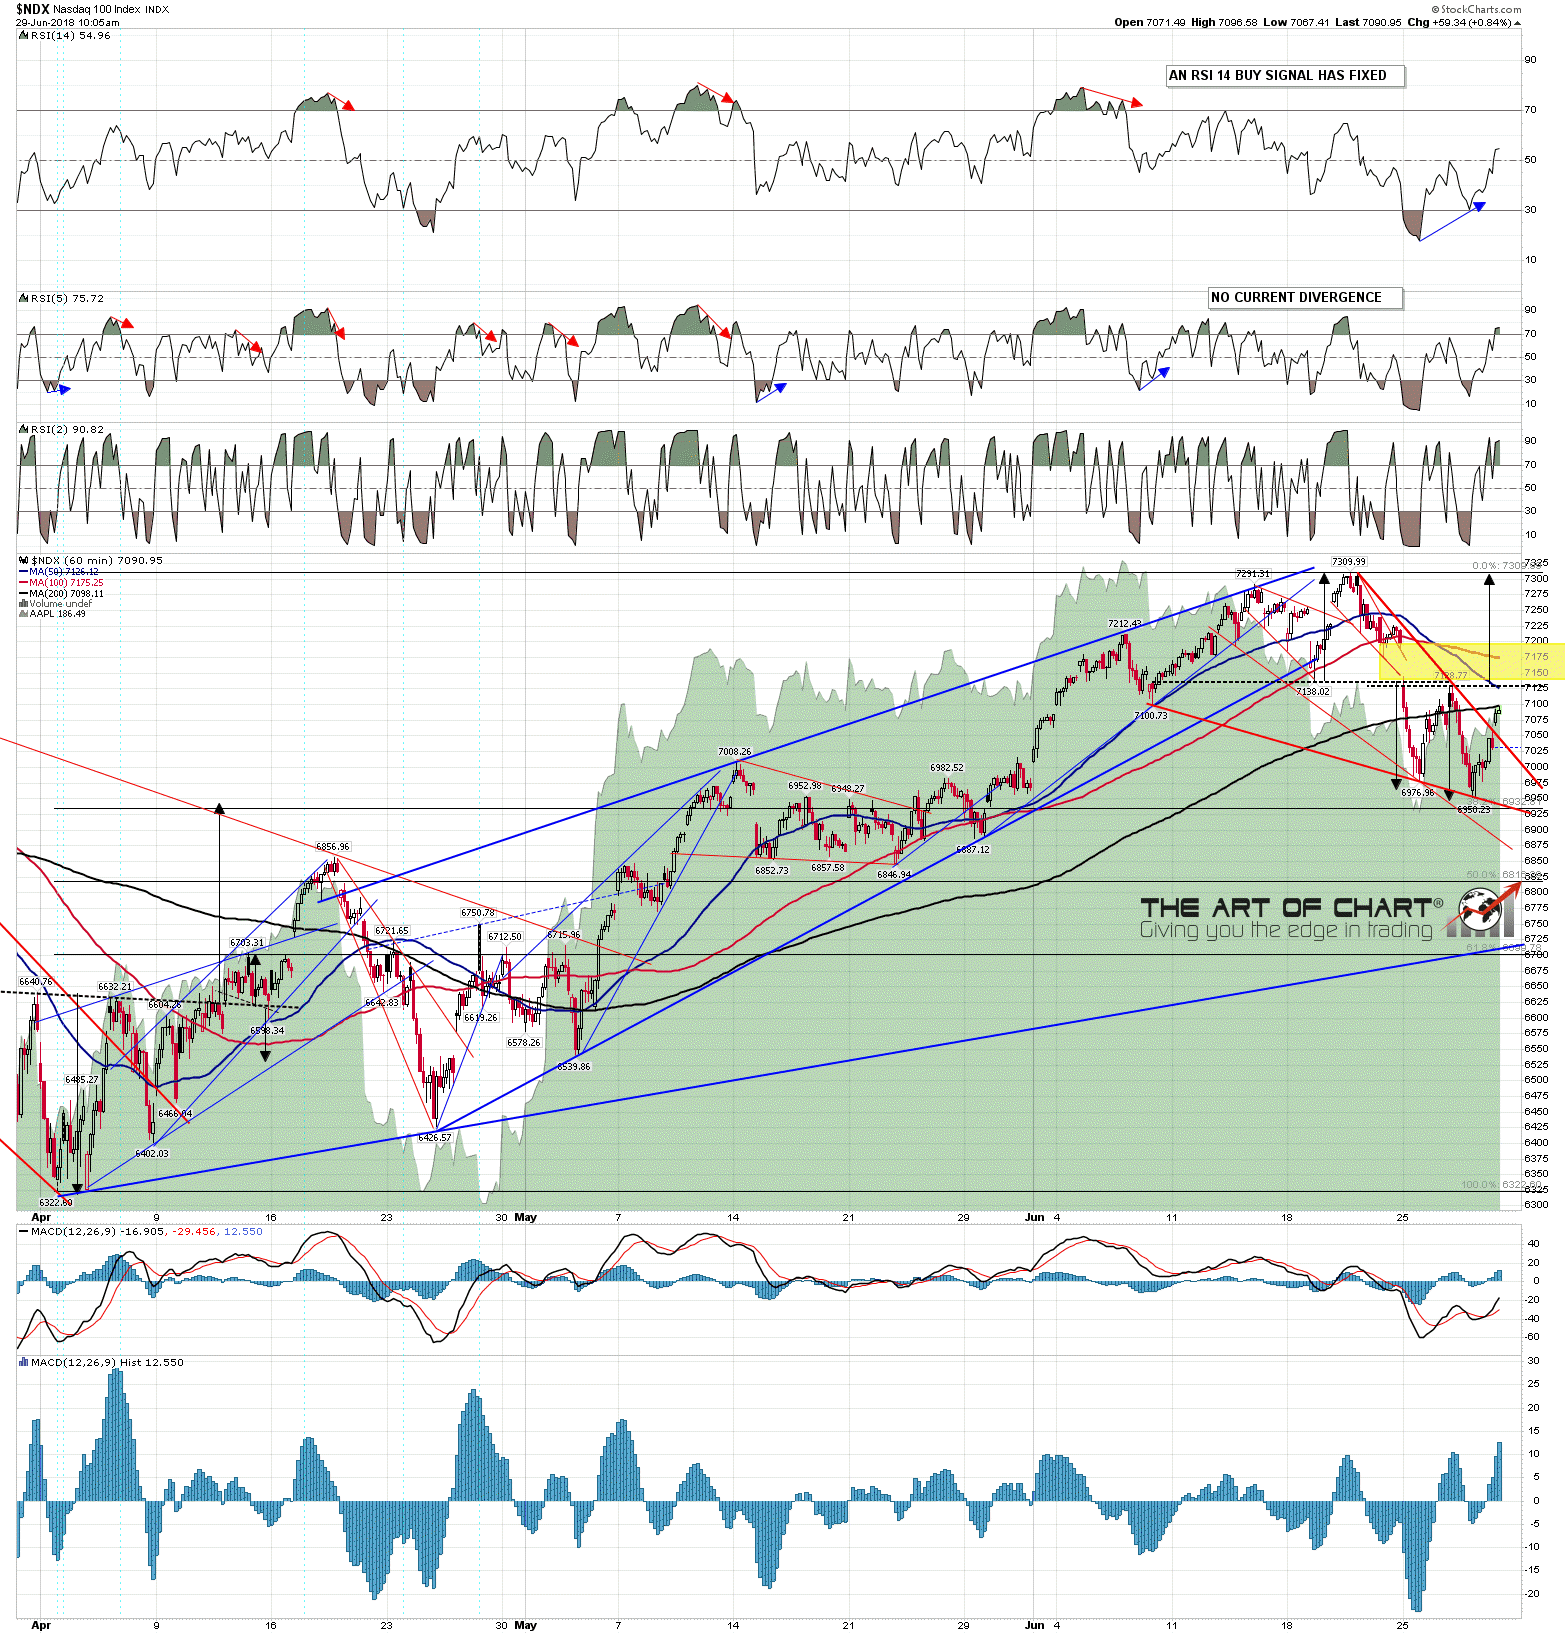
The cleanest reversal setup is on NDX, with a falling wedge / bull flag that broke up this morning, another hourly RSI 14 buy signal fixed this morning and a double bottom setup to point the way back to the high retest that would also be the minimum bull flag setup. Any retracement today will look like a buy to me. You might still be reluctant to be long yet subject to more confirmation, but this isn’t a setup that I’d be at all keen to short.
The weather is nice here in the UK for once. There’s a strange yellow ball in the sky which I understand from google is called a ‘sun’. Not a common sight in the UK at all so I’ll be cautiously investigating this phenomenon over the next few days. Everyone have a great weekend! 🙂
NDX 60min chart: