Well, everyone on the planet is talking about Melania’s jacket:
Slope of Hope Blog Posts
Slope initially began as a blog, so this is where most of the website’s content resides. Here we have tens of thousands of posts dating back over a decade. These are listed in reverse chronological order. Click on any category icon below to see posts tagged with that particular subject, or click on a word in the category cloud on the right side of the screen for more specific choices.

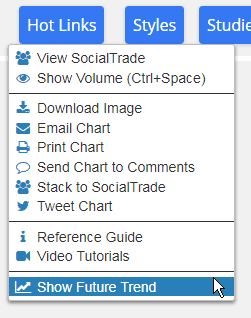
Future Trend is LIVE!
I am delighted to announce another enhancement to SlopeCharts, which is the only charting platform I use. We have created something I call Future Trend, which does something I doubt any of you have seen anywhere else: it shows the next two YEARS of price data.
Now, let me stop right here and make super-dee-dooper crystal clear something that only an idiot or a lawyer would not understand: these projections are virtually guaranteed to be WRONG. Do you honestly think I have access to the next two years of stock data? If I did, I wouldn’t be running these stupid ads on the site and collecting pizza money? (This is another subtle tip that PLUS people are the ONLY people that keep Slope going – – hint, hint).
However, what we have done is created our own proprietary system which uses historical price data and seasonal trends to project an idealized and hypothetical path forward for a given security. Accessing this super-cool new feature is a cinch; just use the Hot Links menu:
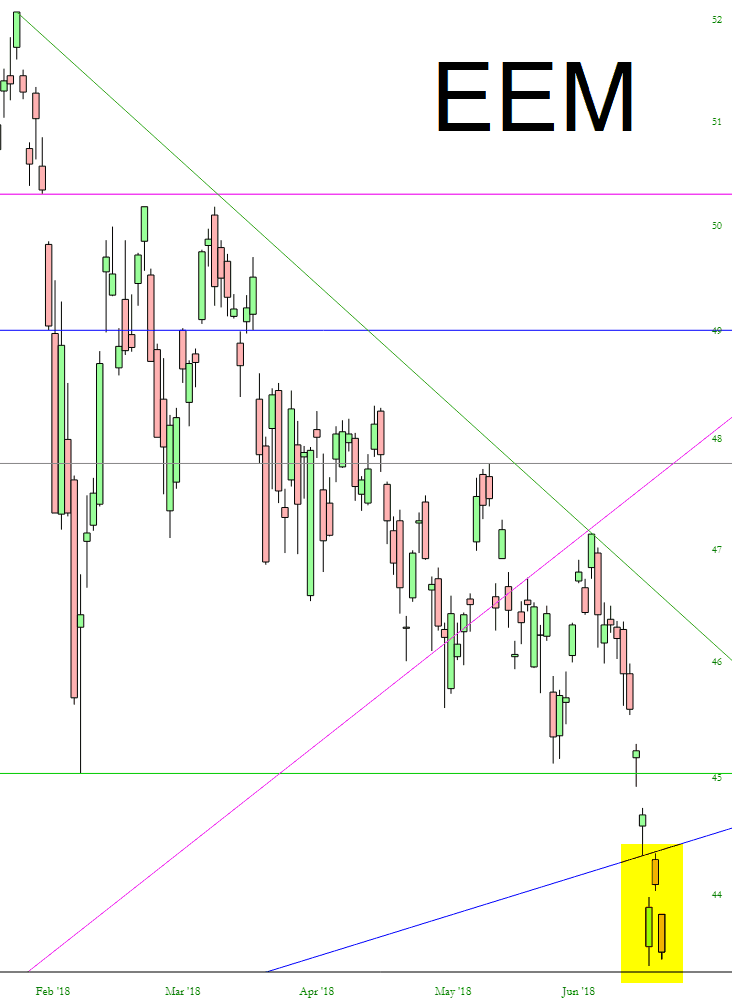
Make ALL Markets Like This
One of the few broad charts that has been in a clear, defiant, screw-the-bulls downtrend has been emerging markets. Every attempt to artificially prop it higher has been smacked across the skull with a sledgehammer, and even yesterday’s ill-fated attempt to fake out the public has yielded nothing more than an island reversal pattern. If only everything else could look like this. Seeing the NASDAQ wiped out over the next five years would sure put a smile on my sour face, plus it would lighten up traffic where I live.
A Bull Flag Megaphone Taking Shape
Apologies for the lack of updates this week. It has been extremely busy. I should be back on a more normal schedule next week. Stan and I are doing our monthly free public webinar on FAANG stocks and key sectors tonight, and if you’d like to attend you can register for that on our June Free Webinars page.
It has been an irritating week on the indices, from a promising start on ES/SPX and NQ/NDX, with high quality H&S patterns breaking down on all four, with then the H&S patterns on NQ/NDX failing into higher highs, and then the H&S on ES being invalidated at the highs last night, leaving the H&S on SPX as the sole survivor of the four patterns, having escaped invalidation by 0.13 handles at the highs yesterday. That still has an open target in the 2725 area.
So what is actually happening here? Well the overnight high on ES was very interesting as it established a three touch declining resistance trendline from the high. That was interesting because it suggests that a flag pattern is forming and, as long as that resistance holds, then ES should be on the way to confirm a pattern support trendline. After I recorded the video below I had a careful look to see if I could identify likely targets and I found two, both falling megaphone support alternate trendlines, and by the close today they would be in the 2728 and 2720 areas respectively. If ES trends down today, which I was talking about as a strong probability on the premarket video below, and is looking increasingly likely at the time of writing, then the target for this move is likely to be one of those trendlines. (more…)
