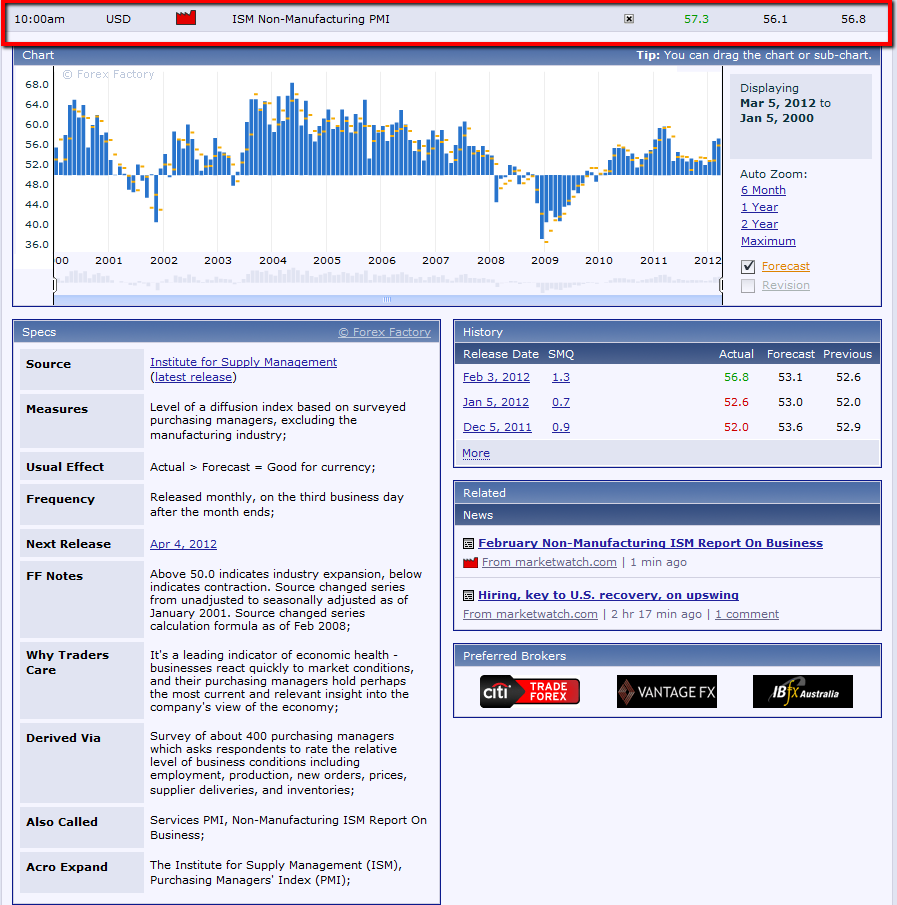
Mixed data released today shows that ISM Non-Manufacturing PMI rose, while Factory Orders declined, as shown on the graphs below…conflicting messages for a second month. Take your pick as to which one you like!
Slope initially began as a blog, so this is where most of the website’s content resides. Here we have tens of thousands of posts dating back over a decade. These are listed in reverse chronological order. Click on any category icon below to see posts tagged with that particular subject, or click on a word in the category cloud on the right side of the screen for more specific choices.
By Strawberry Blonde -
Mixed data released today shows that ISM Non-Manufacturing PMI rose, while Factory Orders declined, as shown on the graphs below…conflicting messages for a second month. Take your pick as to which one you like!
By TNRevolution -
By Tim Knight -
….or, if you're sick of charts, you can enjoy some high-speed footage capture of my rocket launches this weekend. These make excellent analogs of how slowly it's going to dawn on the bulls that the world is doomed and they are wholly deluded.
By springheel_jack -
Two of the most interesting charts to watch at the moment are the charts for the Dow and TRAN indices. I posted my divergence chart on Friday morning with the short term wedges marked in, and posted the separate close-up short term charts on twitter. The Dow rising wedge is showing definite signs of breaking down and that's something to watch today. Here's the combined bigger picture chart again:

By Dpinsen -
Looking Back At Last Week's Gold 'Flash Crash'
Hello fellow Slopers,
Reviewing last week's Slope posts, I noticed Gary Tanashian's bullish guest take on gold last Wednesday ("Why Gold & Why Now?"). Gary reiterated the long-term bullish case for gold in the wake of Tuesday's sell-off. In this weekend's FT, John Dizard's column on the sell off ("Gold flash crash rouses suspicions of witchraft") offered some support for the bullish case, to the extent that it suggested last Tuesday's shock likely wasn't a harbinger of another significant correction.
Dizard's columns are usually worth reading in full, and this one is no exception, but this was his argument in a nutshell: Dizard cited research by fixed income strategist David Goldman. who noted that gold and TIPS are both highly correlated, since “they are both deep out of the money options on catastrophic changes in the price level”; since TIPS didn't react nearly as strongly as gold on Tuesday, Goldman argued that indicated the sell-off in gold wasn't that significant.
Neverthless, for gold longs who want to hedge their bets, at the bottom of this post I've included a screen capture of the optimal puts to hedge the gold-tracking ETF GLD against a greater-than-20% drop over the next several months. Before that, though, a quick reminder about optimal puts, and a look at how the cost of hedging GLD fluctuated last Tuesday, before and after Bernanke moved the markets.
About Optimal Puts
Optimal puts are the ones that will give you the level of protection you want at the lowest possible cost. Portfolio Armor (available on the web and as an Apple iOS app) uses an algorithm developed by a finance Ph.D. to sort through and analyze all of the available puts for your position, scanning for the optimal ones.
Hedging GLD With Optimal Puts Last Tuesday — Before And After Bernanke
By coincidence, I happened to look at the cost of hedging GLD Tuesday morning, prior to the Bernanke excitement. I tweeted this from the Portfolio Armor account at the time:
Cheap to hedge $GLD against a greater than 20% drop between now & September – 0.8%. Longs should consider it. twitter.com/PortfolioArmor…
— Portfolio Armor (@PortfolioArmor) February 29, 2012
Less than two hours later I noted that the cost of hedging GLD against a greater than 20% drop (from its then-lower price) had jumped more than 50%:
Recall our earlier tweet, which showed cost if hedging $GLD at 0.8% of position? 2 hours later it's 1.24%. twitter.com/PortfolioArmor…
— Portfolio Armor (@PortfolioArmor) February 29, 2012
The Current Optimal Puts To Hedge GLD
Below is the optimal put option contract to hedge 100 shares of GLD against a greater than 20% drop between now and September 21st. A note about these optimal puts and their cost: to be conservative, Portfolio Armor calculated the cost based on the ask price of the options. In practice, an investor can usually buy put options at a lower price, i.e., at some point between the bid and the ask prices.
