
As any unfortunate soul who has ever lived with me can attest, I am a neat freak. I like things orderly. If you have some books out and head to the bathroom, the books will probably be gone when you return. It’s just how I am. Terribly sorry. Those books weren’t being used.
This works out better for product development, however, because I am ceaselessly trying to bring order to places where chaos abides. With SlopeCharts, I was increasingly bothered that as we kept adding features, the menus got more and more cluttered. I feared that our marvelous feature set would get buried under all the clutter.
Thus, this weekend, we totally reworked how the menus were organized. I am much happier now with what I call our DATS setup: that is, Display, Analysis, Tools, and Social.
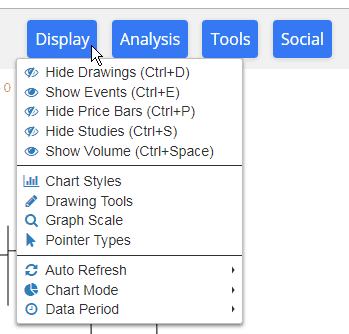
The Display menu is about the features which affect appearance:
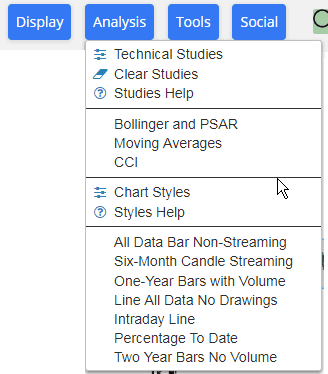
Analysis has to do with technical indicators, study sets, and style sets:
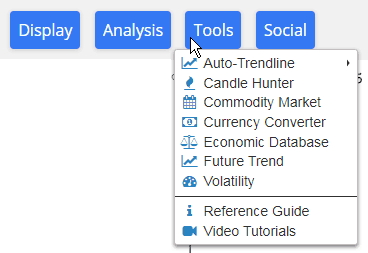
Tools is a catch-all for power features, many of which are for premium members:
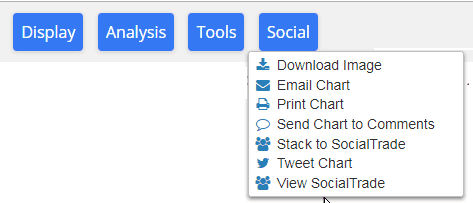
Social is for the preservation and sharing of your creations:
In one fell swoop, however, I have probably rendered much of the documentation and videos related to the product to be out-of-date. So……….no rest for the weary.
I hope this superior “exposure” of SlopeCharts‘ features is appealing to the users out there.
