Slope of Hope Blog Posts

Slope initially began as a blog, so this is where most of the website’s content resides. Here we have tens of thousands of posts dating back over a decade. These are listed in reverse chronological order. Click on any category icon below to see posts tagged with that particular subject, or click on a word in the category cloud on the right side of the screen for more specific choices.

Need To Know Your ABC

By -

I was saying after the SPX support trendline touch a few days ago that having a strong three-touch support trendline cuts both ways, in that it is strong support while it holds, but can get ugly fast when it breaks. The strength of this push down after the support trendline broke on Wednesday morning was extremely impressive.

That move may be bottoming out for the moment and, if so, that should be the end of wave A, with a wave B rally in progress now or soon, and a likely wave C down after that to complete this move from the high. There are a number of possible options for the wave C low, but my favorite would be a retest of the 2018 low at 2532.69, just under the annual pivot at 2538. There is a possible H&S neckline at that level. If SPX does a 50% retracement from the current low then the target would be in the 2825 area, though there is impressive looking resistance in the 2790 – 2800 area that may hold as resistance.

Full Premarket Video from theartofchart.net – Update on ES, NQ, SPX, NDX, RUT, CL, NG, GC, SI, HG, ZB, KC, SB, CC, ZW, ZC, ZS, DX, EURUSD, USDJPY, USDCAD, AUDUSD: (more…)

Front Month vs 3-Month Volatility Study

By -

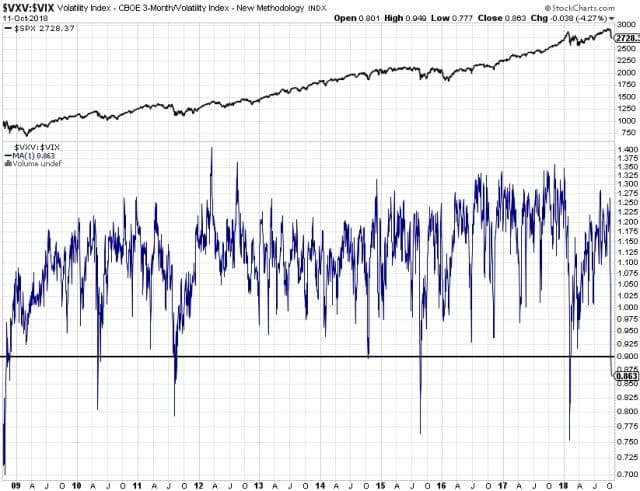
Hey Gang, no trade suggestion this time.  I’m always keeping an eye out for context of the market environment and looking through some charts tonight, it prompted me to do a little study for myself and I thought I would share it with you all.  Here is the ratio of 3-month volatility to front month volatility.  Today, the ratio closed at .863.  Using a cut off line of crossing below .90, this has only happened seven other times during this entire bull market.  I’m ignoring the bear market bottom on this chart for the moment to keep things in context of the market type.  It’s too hard to really get a good sense of the daily price activity in this chart so I’m going to zoom in to each instance.

VXV VIX yrs (more…)