I continue to enjoy Q4 2018, and charts are behaving themselves marvelously.
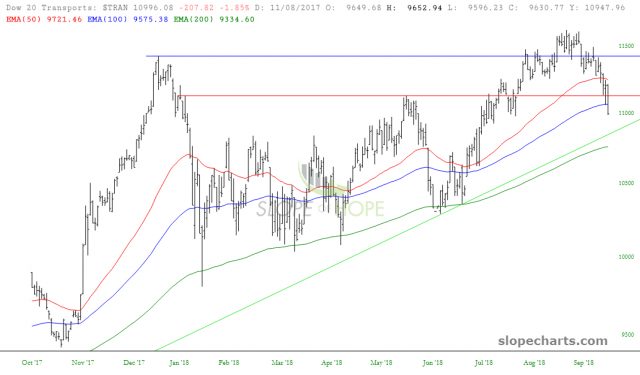
Weakness is certainly starting to grab hold. It was just a few trading days ago that we were at the highest levels in stock market history on the Dow Industrials, but just look at how the Transports are falling to pieces:
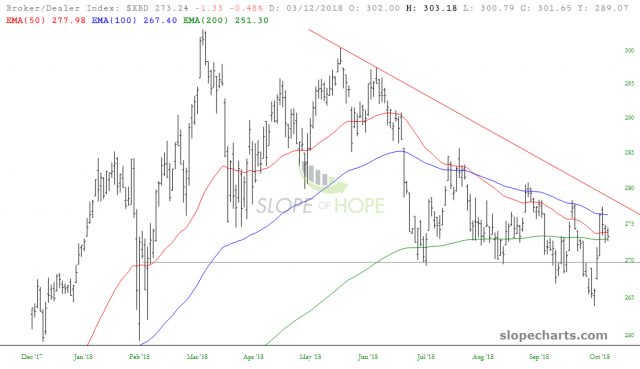
But that isn’t even the important one. I am very focused on specific sectors, such as real estate and financials, for signs of a broad reversal. The broker/dealer index is of particular importance. the 50 day EMA has crossed beneath the 100 day and is on its way toward the 200 as well. On top of that, we appear to be completing a right triangle top.
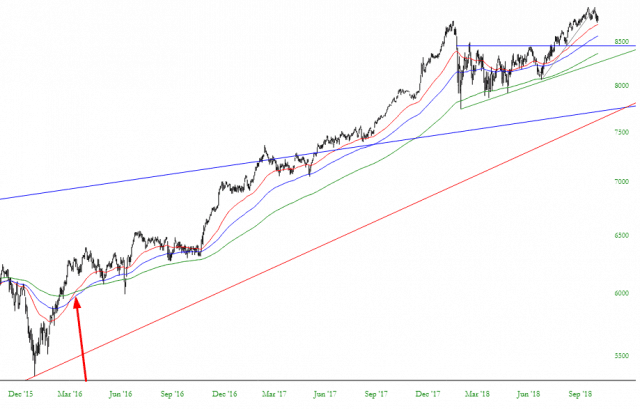
The Dow Composite looks far healthier than this, but notice how the most recent peak was a slightly lower high than the one prior. Even more interesting, look at how this recent high perfectly touched the bottom of the now-broken trendline, showing its role of resistance.
Let’s face it, it has been a very long time since a reasonable downturn. Indeed, the same Dow Composite has had positive moving averages ever since early 2016!
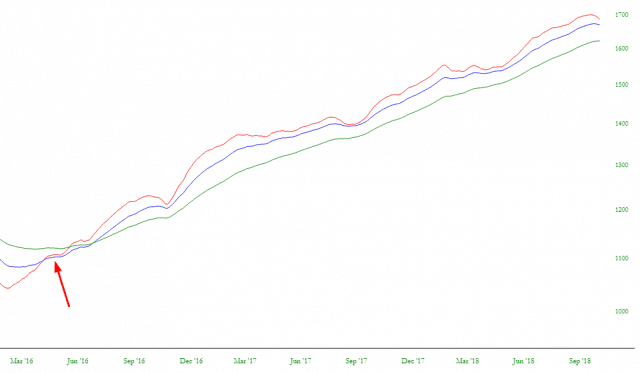
Precisely the same can be said of the broader Russell 2000 index. That arrow marks the crossover point, and it’s been positive ever since. The big question is whether the most recent “softening” of the averages is going to result in a true crossunder, or if it’s just another “tease”, which has happened three prior times during the past couple of years.


